Research Articles

Economic development and energy efficiency in Jilin Province, China

  • ZHANG Huimin , 1, 2 ,
  • QIU Fangdao 3 ,
  • WEI Qiang 1, 2 ,
  • TONG Lianjun 1 ,
  • YE Xinyue 4 ,
  • CHENG Yeqing , 5
Expand
  • 1. Northeast Institute of Geography and Agroecology, CAS, Changchun 130102, China
  • 2. Graduate University of Chinese Academy of Sciences, Beijing 100049, China
  • 3. School of Urban and Environmental Sciences, Jiangsu Normal University, Xuzhou 221116, Jiangsu, China
  • 4. Department of Geography, Kent State University, Kent, Ohio 44242, USA
  • 5. College of Geography and Tourism, Hainan Normal University, Haikou 571158, China

Author: Zhang Huimin (1977-), PhD Candidate and Associate Professor, specialized in ecological economy. E-mail:

*Corresponding author: Cheng Yeqing, E-mail:

Received date: 2013-12-17

  Accepted date: 2014-01-20

  Online published: 2014-05-20

Supported by

National Natural Science Foundation of China, No.41071086.No, 41371146.Key Project of the Ministry of Education of China, No.11YJA630008.Key Research Program of the Chinese Academy of Sciences, No.KZZD-EW- 06-03.No.KSZD-EW-Z-021-03

Copyright

Journal of Geographical Sciences, All Rights Reserved

Abstract

The relationship between economic development and energy consumption is revealed by employing cointegration theory, the index decomposition method, and a log-linear regression approach based on a case study of Jilin Province, China. The results suggest: 1) the economic development and energy consumption are interdetermined, whose relationship is positive and long-term. The economic development is highly depending on the energy in Jilin Province. 2) Under the condition of other unchanged factors, the change of industrial energy efficiency contributes to the energy saving, while that of industrial structure increases the energy consumption. 3) The industrial structure change enhances the energy intensity, but the energy utility efficiency change lowers it. From the view of contribution to the energy consumption, the contribution of industrial structure was more than that of the energy utility efficiency in 2000-2011. 4) In 2000-2011, the comprehensive energy intensity change and hydroelectricity energy intensity change were related to all industrial structures’ change, and the influencing factors about structure of oil energy intensity change were more than those of coal energy intensity change; from the impact degree, agricultural proportion decreased exerted an positive and greater effect on lowering the energy intensity of comprehensive energy and hydroelectricity, and industrial one did on coal and natural gas. Some conclusions can be drawn as follows: the major way to promote the coordinated development of the industrial economy and energy consumption is to optimize the industrial structure by increasing the proportion of the tertiary industry and low energy consumption industrial sectors and to enhance the energy utility efficiency.

Cite this article

ZHANG Huimin , QIU Fangdao , WEI Qiang , TONG Lianjun , YE Xinyue , CHENG Yeqing . Economic development and energy efficiency in Jilin Province, China[J]. Journal of Geographical Sciences, 2014 , 24(5) : 875 -888 . DOI: 10.1007/s11442-014-1126-y

1 Introduction

Rapid economic development leads to an increasing focus of attention on the accompanying growth in energy consumption. The relationship between economic development and energy consumption has been widely studied. Energy is regarded as a basic element of the production process, so its consumption is strongly related to the sustainability of economic development. A number of econometric models have been established to reveal the interdependence between energy consumption and economic growth, based on the hypothesis that technological progress is exogenous or endogenous to the improvement of energy utility efficiency (Kraft and Kraft, 1978; Yu and Choi, 1985; Yu and Jin, 1992; Stern, 1993; Wu et al., 2005; Li, 2005; Altinay and Karagol, 2004; Hu et al., 2011; Chefurka, 2007a; Cheng et al., 2013). Nevertheless, the degree of interdependence varies across space and over time, and sometimes it is affected by the analytical methods adopted in a study. Second, energy intensity has been the subject of some controversy in studies of energy efficiency (Ang, 2006; Dixon et al., 2010; Zhou and Ang, 2008; Wang et al., 2010; Wang and He, 2009). Most studies analyze the temporal change of energy intensity and its driving factors at the macro scale, using index decomposition, gray relational analysis, and log-linear regression analysis (Buluş and Topalli, 2011; EESI, 2010; Gottron, 2001; Greening et al., 2000; Huesemann and Huesemann, 2011; Greening et al., 2000; Chefurka, 2007b; Manufacturing Institute, 2005; Woolf and Lutz, 1993; Zhao et al., 2012; Liu et al., 2012). However, the conclusions are mixed (Ang and Zhang, 2000; Ma et al., 2010; Zhang, 2008; Qu, 2009). It has been hotly debated which factor is dominant and whether it supports or restrains the energy intensity. In most studies of the Chinese economy, economic structure has been considered to be an important factor influencing energy intensity (Ma et al., 2010; Wei and Shen, 2009; Xu and Liu, 2004; Shi and Zhang, 2003).
As the traditional industrial base of China, Jilin Province has been facing the challenge of greater energy consumption due to rapid economic growth since the completion of economic reforms in state-owned enterprises in 2000. The policy of revitalizing the old industrial base has led Jilin Province toward reindustrialization. The province has experienced similar challenges to those faced by old industrial regions in the West, such as the Ruhr in Germany, the Great Lakes industrial districts in the United States, and the Black Country in England. These challenges include resource exhaustion, a single-industry structure, and retarded economic growth. In contrast to these regions in the West, however, Jilin has not entered the stage of industrial decay, nor has it suffered from an intensive industrial pattern, high land prices, and poor competitive ability of its industrial products. The economic reforms led to a change in the policy that had favored the coastal economy and state-owned enterprises. Hence, the dilemma of decreasing energy consumption and increasing economic growth were more serious than that in the old industrial regions in the West. During the period 2000-2011, GDP in Jilin grew by 12.13% annually (Jilin Statistical Bureau, 1996-2012). At the same time, energy demand and consumption soared, and there were such deficits as small-scale production and unscientific adjustment in energy development. Through analyzing the spatial and temporal characteristics of energy consumption and economic development, the research reported in this paper aims to identify their interaction during 2000- 2011.

2 Study area and method and data

2.1 Study area

Jilin (Figure 1) lies in the central part of Northeast China (40°52′-46°18′N, 121°38′-131°19′E), bordering Russia and North Korea in the east and southeast, respectively. Jilin has a total area of 18.74 km2 and a total population of 27.3 million. Major cities in this province include Changchun, Jilin City, Siping, Liaoyuan, Tonghua, Songyuan, Baishan, and Baicheng. Its capital is Changchun.
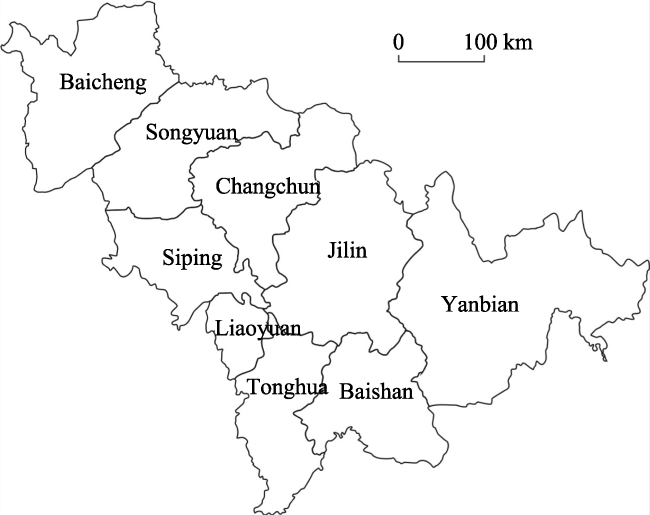
Figure 1 Sketch of the study area
Jilin has a northerly continental monsoon climate, with long, cold winters and short, warm summers, with an annual temperature of 3-5°C. The average rainfall is 500-910 mm. Topographically, Jilin is the highest in the southeast, and drops gently toward the northwest. The eastern part of the province is the mountainous area of the Changbai Mountains, with an elevation of over 1,000 m. The western part of the province is the Songliao Plain, whose low and level western section is the grain production base of the province. Jilin is rich in natural mineral deposits, with 136 different types of minerals, of which 70 have already been extracted including iron, nickel, molybdenum, talc, graphite, gypsum, cement rock, gold, and silver. The province also has large reserves of oil, gas, and coal.
Jilin is China’s most important industrial and crop production base. Industry in Jilin is concentrated on the production of chemicals, automobiles, railway carriages, and iron alloys. In the 1990s, Jilin, together with the rest of heavy-industry-based Northeast China, faced economic difficulties. This prompted the Central Government to undertake a campaign called “Revitalize the Northeast.”

2.2 Method

2.2.1 Cointegration and cointegration test
If two or more time series are respectively integrated but their linear combination has a lower order of integration, the series are called cointegrated and stationary linear combination cointegrated equation (Gujarati, 2005; Zhang, 2007). The Granger cointegrating vector approach is usually used to test whether a causal relationship exists among time series (Gujarati, 2005; Zhang, 2007). The Engle-Granger two-step method tests for a cointegration relationship among time series and estimates cointegration vectors using ordinary least squares (OLS), and if the time series are cointegrated, the residual obtained in the first step is put into the error correction model as a nonstationary error to estimate corresponding parameters by OLS (Gao, 2006). This paper adopts the augmented Dickey-Fuller (ADF) test for the stationarity of time series. If they pass the test, a Granger analysis is performed to detect any relationship between industrial economic development and energy consumption. Finally, the residual is subjected to the ADF test to reveal the regression relation between industrial economic development and energy consumption.
2.2.2 Index decomposition analysis
Since the 1980s, index decomposition analysis (IDA) has been extensively used in energy research. Based on statistical index theory, IDA is employed to analyze the direction and degree of an impact factor on the object variable under the condition that other impact factors remain unchanged.
(1) Absolute quantity analysis
In absolute quantity analysis, the major driving factors on energy consumption can be decomposed into a scale effect, a structure effect, and a technical effect (Shi, 1999a; Zhang and Gong, 2010; Zhang, 2003):
where ΔE is the comprehensive energy consumption change, E0 and Et are the comprehensive energy consumptions in the initial and the tth years, Q0 and Qt are the GDPs in the initial and tth years, Si,0 and Si,t are the shares of the ith sector’s production in GDP in the initial and tth years, Ii,0 and Ii,t are the ith sector’s energy intensities in the initial and tth years, and ΔEout, ΔEstr, and ΔEint are the scale effect, structure effect, and technical effect, respectively.
(2) Relative share analysis
Relative share analysis is mainly applied to the energy intensity, the change in which can be decomposed into changes in sector structure and energy intensity:
where It is the energy intensity in the tth year, Et is the comprehensive energy consumption in the tth year, Qt is the GDP in the tth year, Eit and Qit are respectively the energy consumption and production of the ith sector in the tth year, Iit is the energy intensity of the ith sector in the tth year, and Sit is the production share of the ith sector in GDP in the tth year. The energy intensity can be decomposed into a weighted average of the energy intensities of the sectors, with the weights being the production shares of each sector.
Using IDA, the change in energy intensity can be decomposed into a structure index Fstr and an energy utility efficiency index Feff (efficiency index for short). Fstr is the change in energy intensity resulting from a change in industrial structure and with the energy utility ability remaining unchanged. Feff is the change in energy intensity resulting from a change in energy utility ability with the industrial structure remaining unchanged. To complete the decomposition of the energy intensity change without residual, this paper employs the Fisher ideal index (Fisher et al., 2004) to obtain the structure index and efficiency index (Boy et al., 2004; Song et al., 2012):
I0t =It/I0=
where I0 is the energy intensity in the initial year and the rest of the notation is as described above. Setting
gives
I0t = FstrFeff (5)
A decrease in energy intensity will reduce energy consumption, with the decrease in energy consumption (△E) being defined as
where Et is the real energy consumption, 
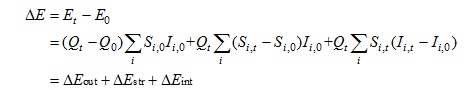
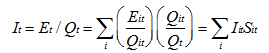
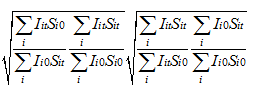
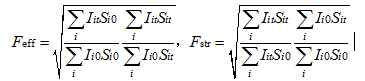
is the energy consumption in the tth year, with the energy intensity in the initial year being unchanged. The contributions of changes in industrial structure and in energy efficiency to the decrease in energy consumption (i.e., ΔEstr and ΔEeff) can be written as follows:
2.2.3 Logarithmic linear regression analysis
IDA reveals the impact of changes in industrial structure on energy consumption, rather than the impact of changes in sector structure on energy intensity (Shi and Zhang, 2003). By extending the work of Shi et al. (2003), the present research analyzes the impact of changes in sector structure on the energy intensity using the ADF test and a linear logarithmic regression model based on a vector error correction model (VECM) (Gujarati, 2005; Zhang, 2007; Gao, 2006). Referring to the sectoral division of energy consumption in the China Energy Statistical Yearbook, this paper selects agriculture (including farming, forestry, animal husbandry, side-line production, and fishery), industry, architecture, transportation, and wholesale and retail trades as elements (Boy and Roop, 2004; Song and Wang, 2012; Metcalf, 2009).
Denoting the comprehensive energy consumption by E and the production shares of agriculture, industry, architecture, transportation, and wholesale and retail trades in the GDP by S1, S2, S3, S4, and S5, respectively, the energy intensity E/GDP is given by the following formula:
ln(E/GDP) = c+b1lnS1+b2lnS2+ b3lnS3+ b4lnS4+ b5lnS5 (8)
where b1, b2, b3, b4, and b5 are the coefficients of industry, architecture, transportation, and wholesale and retail trades, respectively; c is a constant. Here the factors related to energy consumption comprise comprehensive energy consumption, coal consumption, petroleum consumption, natural gas consumption, and hydroelectricity consumption.

2.3 Data source

The comprehensive energy consumption in this study is the total energy consumption of material and nonmaterial production sectors, including raw coal and its products, crude oil and its products, natural gas, and hydroelectricity (Fisher et al., 2004). The comprehensive energy consumption can be divided into final energy consumption, energy processing and conversion loss, and loss. The GDP of Jilin Province is selected to represent the total economic growth and the production of a sector represents the change in the industrial economic structure. The data come from the Jilin Statistical Yearbook, the China Industry Economy Statistical Yearbook, the China Energy Statistical Yearbook, the China Statistical Yearbook, the Statistical Bulletin of the National Economic and Social Development of Jilin Province, and the Jilin Yearbook. For data comparability, all data with monetary measures were deflated by data in 2000 referring to the GDP price index (Finemood, 2012).

3 Industrial development and energy consumption in Jilin

3.1 Industrial development and energy consumption

Jilin was a traditional industrial base, and its industrial sectors have developed rapidly since 1978. GDP has increased from 8.20×10⁹ yuan (RMB) in 1978 to 1.06×10¹² yuan in 2011, with an annual rate of 9.91% (Jilin Statistical Bureau, 1996-2012). After Jilin underwent reindustrialization in 2000, the share of secondary industrial production increased again and was above that of tertiary industry (Figures 2a and 2b). The proportion of primary, secondary, and tertiary industries was 12.1:53.2:34.7, with respective contributions to economic growth of 4.5%, 66.7%, and 28.8% (Jilin Statistical Bureau, 1996-2012). Since 1978, the total production of agriculture, industry, architecture, transportation, and wholesale and retail trades has been around 80%. Among the industrial sectors, manufacture of transport equipment, raw chemical materials and chemical products, food manufacture, information technology, pharmaceuticals, metallurgy and building materials, energy production, and textiles are dominant. The six highest energy-consumption sectors in Jilin, including raw chemical materials and chemical products, mining and processing of nonmetallic, ferrous metal, and non-ferrous metal ores, processing of petroleum, coking, processing of nuclear fuel, and production and supply of electric and thermal power, produced a GDP of 99.446×10⁹ yuan, with a rate of 20.4%. Compared with 2005, the comprehensive energy consumption in these sectors decreased by 5.17%.
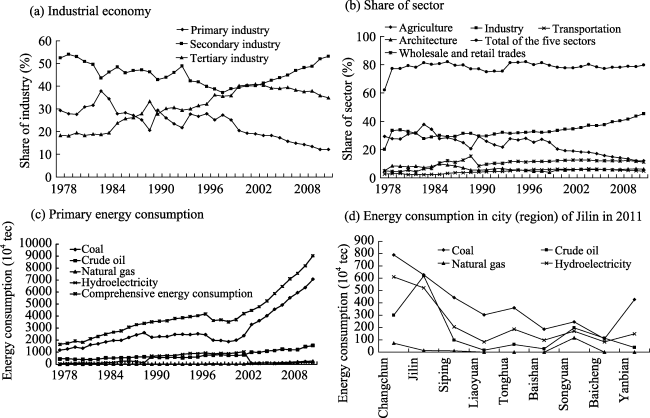
Figure 2 Economic development and energy consumption of Jilin Province in 1978-2011
The structural characteristics of energy consumption are as follows (Figures 2c and 2d).
(1) Coal
Coal has long been the major component in the energy consumption of Jilin, with an average annual share in comprehensive energy consumption of 70% in 1978-2011. As a result of changes in industrial structure in the 1990s and the dramatic development of processing industries, craw coal production slowed and lagged behind. Besides the poor quality and high price of the craw coal produced in Jilin, slow delivery of state monopoly planned coal supplies as a result of limited transportation capacity and restrictions on import of coal from other provinces led to the supply of coal in Jilin being lower than the demand. Coal consumption fell from the year 1997, with its share being only 53% in 2000. The coal price decreased, benefitting from the revitalization of the old industrial base of Northeast China, and coal consumption increased again, rising to a share of 78% in 2011. The coal consumption in Changchun City was the greatest in Jilin in 2011, at 7.9×10⁶ tec.
(2) Crude oil
Oil consumption fluctuated slightly during the period 1978-2011, with an upward trend on the whole. There was a low point in 1994 because of changes in industrial structure, with the share being just 13.8%. With the redevelopment of the old industrial base of Jilin, oil consumption rebounded, and its share was up to 22.4% in 2003. Because oil has to be imported into Jilin from outside China to fill the gap between supply and demand, oil consumption decreased in the international economic crisis of 2008, with its share down to 16% in 2009, but picking up to 17.2% in 2011. Oil consumption in the province is the highest in Jilin City, at 6.18×10⁶ tec.
(3) Natural gas
As a clean form of energy, natural gas has good prospects, but, owing to limitations on production, its consumption is not great. Before 2003, natural gas consumption had a share of less than 1%, although this increased from 2% in 2003 to 2.9% in 2011. In 2011, Songyuan City had the greatest natural gas consumption in the province, at 1.17×10⁶ tec.
(4) Hydroelectricity
Consumption of hydroelectricity was subject to large fluctuations before 2003, especially in the period 1989-2003. Guided by the policy of developing hydroelectricity to relieve the pressure on the coal supply caused by thermal power generation, many hydroelectricity plants were constructed and put into use in Jilin, and the consumption of hydroelectricity rose to a high of 25.6% in 2001, greater than other sources except for coal. However, with expanding power demands since 2003, coal and oil consumption shares have increased and the hydroelectricity consumption share has fallen, and was down to 1.6% in 2011.

3.2 Energy intensity

Energy intensity, as a measure of the energy efficiency of a nation’s economy, is calculated as units of energy consumption per unit of GDP. Energy intensity as defined here is not to be confused with energy use intensity (EUI), a measure of building energy use per unit area.
The energy intensity of Jilin has shown a significant downward trend since 1978. It was 6.11 tec/104 yuan in 1978, and 1.22 tec/104 yuan in 2011 (Figure 3a). Energy efficiency has increased year by year. The reason is that, following reform and opening-up in 1978, rapid economic development and better technology have led to the introduction of measures to reduce energy consumption by production processes, improving energy conversion and utilization. At the same time, Jilin Province has been developing light industries and tertiary industry instead of heavy industries, resulting in an increase in GDP accompanying the decrease in energy consumption. The energy intensity in Jilin is higher than the average for China, although the gap has been shrinking, from 1.729 tec/104 yuan in 1978 to 0.0389 tec/104 yuan in 2011. Industry had the highest energy intensity of any sector, above 2 tec/104 yuan (Figure 3b). Agriculture, architecture, and wholesale and retail trades had lower energy intensities of about 0.5 tec/104 yuan, while that of transportation was about 1-2 tec/104 yuan.
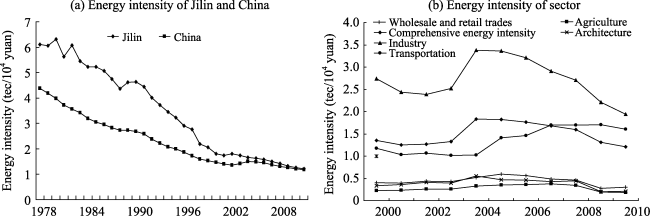
Figure 3 Energy intensity in Jilin Province

4 Mechanism of industrial economy and energy consumption

4.1 Comprehensive energy consumption and GDP

To avoid spurious regression, the unit roots of comprehensive energy consumption and GDP in Jilin were subjected to the ADF test using Eviews6.0. The two variables passed the test with zero lag at first order, indicating that they are stationary. Granger causality tests indicated that the comprehensive energy consumption and GDP were mutual Granger causes, improving each other. Using the Engle-Granger two-step method, the following linear regression equation was obtained for the GDP (Y) and the comprehensive energy consumption (X):
lnY = 1.757428lnX - 13.52677 (R2 = 0.988031) (9)
All variables are at the 0.01 level of significance.
There is a long-term equilibrium relation between GDP and comprehensive energy consumption, in which the higher the economic scale, the greater are the demands on energy (Figure 4). The principal reason for this is that Jilin Province has developed resource-based economies depending on its abundant resources, and energy is the important foundation.
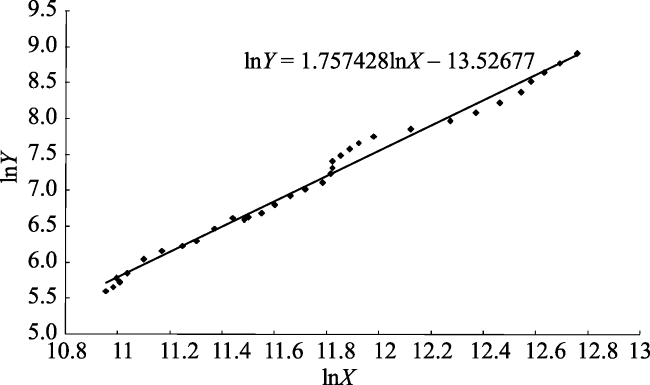
Figure 4 Coordinated analysis of GDP and comprehensive energy consumption
The impact factors on comprehensive energy consumption in Jilin were analyzed using absolute quantity analysis with the IDA. From Equation (1), the results were as follows:
(i) The real comprehensive energy consumption increased by 53.90×10⁶ tec in 1979-2011.
(ii) With other factors unchanged, the increase in GDP increased the comprehensive energy consumption by 65.18×10⁶ tec in 1979-2011.
(iii) With other factors unchanged, the change in industrial structure increased the comprehensive energy consumption by 18.96×10⁶ tec in 1979-2011.
(iv) With other factors unchanged, the increase in industrial energy intensity reduced the comprehensive energy consumption by 30.24×10⁶ tec in 1979-2011.
Resource-based economies of scale will be retained in Jilin for a long time, and consequently it will not be possible to reduce energy consumption by decreasing the GDP in the near future. Industry will have an important role to play in the period of reindustrialization, so it is unrealistic to decrease energy consumption by increasing the share of tertiary industry. In conclusion, the key energy-saving measures are improved energy technology and increased efficiency of energy use, together, to a certain extent, with changes to the sectoral structure of industry, to provide an environment-friendly and energy-friendly economy in Jilin.

4.2 The industrial structure and energy intensity

4.2.1 Decomposition of energy intensity
Trends in energy intensity and the results of the decomposition for 2000-2011 are shown in Figure 5a. Taking 2000 as the base year, the energy intensity was 1.22 tec/104 yuan in 2011, which was 88% of that in 2000.
From Equation (4), the efficiency index in 2011 was 72% of that in 2000. This means that if the industrial structure had remained unchanged in 2000-2011, changes in energy efficiency would have reduced the energy intensity in 2011 to 72% of that in 2000. Hence, improvements in energy utility efficiency will reduce the energy intensity and increase energy-saving profits.
The structure index in 2011 was 121% of that in 2000. This means that if the energy efficiency had remained unchanged in 2000-2011, the change in industrial structure would have increased the energy intensity in 2011 to 121% of that in 2000. Hence, the change in industrial structure will increase the energy intensity. This conclusion is opposite to that of other researchers (Shi, 1999b).
Equations (6) and (7) give the impact of changes in energy intensity on comprehensive energy consumption in 2000-2011. From the relative contributions of industrial structure and energy efficiency to energy consumption in 2000-2011 (Figure 5b), it can be seen that the change in industrial structure is the major contributory factor.
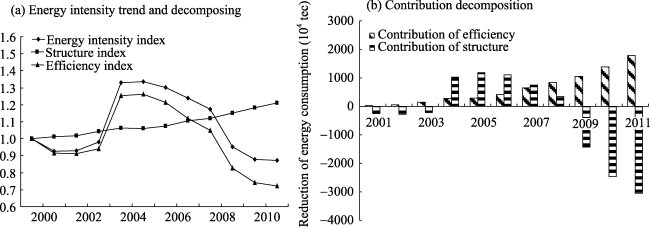
Figure 5 Decomposition of the energy intensity index for Jilin Province in 2000-2011
4.2.2 Influence of industrial structure on energy intensities
From the end-use energy consumption of industries shown in Figure 6, it can be seen that the trend of total end-use energy consumption in Jilin is in accordance with that of industry, with the end-use energy consumption of industry being 70% of total end-use energy consumption. In 2003, the demand for energy by industry constituted the greater share of energy consumption with the implementing of policy to revitalize the old industrial base of Northeast China, and remained unchanged for a short period. Driven by industrial development, there was a rapid growth in transportation, and energy consumption increased. On the whole, the energy consumptions of agriculture, architecture, transportation, and wholesale and retail trades have remained almost constant.
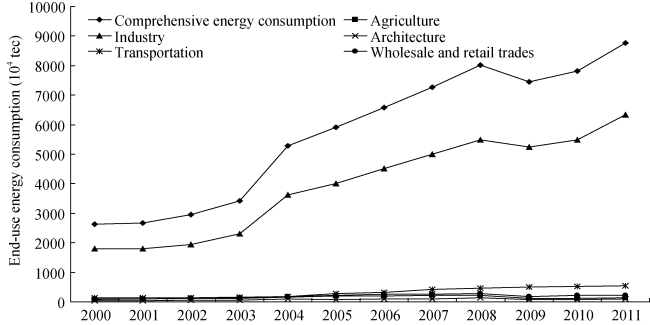
Figure 6 End-use energy consumption of industries and the proportion of primary energy in Jilin Province in 2000-2011
Energy utility efficiency in Jilin has been enhanced by investments in upgrading machinery to improve energy savings, but remains low. All variables passed the ADF test with zero lag at second order.
Regression analysis shows that changes in industrial structure had a varied influence on the energy intensities of different forms of energy (Table 1). And it is found that the energy intensity of hydroelectricity changed with all industries’ structures; that of crude oil was relative to more industries’ structures than coal, and different to coal; those of coal and natural gas had less impact factors about industries’ structure, of which the energy intensities of coal is sensitive to industrial structure. The reduction in agriculture led to decreases in the energy intensities of comprehensive energy consumption, coal consumption, and hydroelectricity consumption. These decreases in the intensities of comprehensive energy consumption and hydroelectricity consumption due to agriculture were greater than the increases resulting from other sectors. The effects of industry on the energy intensities of coal and natural gas consumption were the greatest, so an industrial boom would provide an impetus to their growth. Industry, transportation, and wholesale and retail trades all use the main products and by-products of crude oil, and consequently these sectors have an influence on the energy intensity of crude oil.
Table 1 Impact of industrial structure on the comprehensive energy intensity and primary energy intensity of Jilin Province in 2000-2011
Coefficient Comprehensive
energy
consumption
Coal Crude oil Natural gas Hydroelectricity
Agriculture b1 0.487756* 0.600494** -0.262159** 8.691498***
Industry b2 -0.270625** -1.135298*** -0.411651* -0.852224*** -8.461238*
Architecture b3 0.546025* -3.663890*
Transportation b4 -0.197382** -0.606028*** -0.093246*** -3.390937*
Wholesale and retail trades b5 -0.023593 0.62947*** 0.755458*** 0.294615*** 3.254306***
R2 0.949856 0.884672 0.933196137 0.614603 0.821914

*p<0.1, **p<0.05,***p<0.01; —, not significant.

5 Conclusions and discussion

5.1 Conclusions

This article has analyzed the relationship between energy consumption and industrial development in Jilin using cointegration theory, the index decomposition method, and a log-linear regression approach. The conclusions are as follows.
First, economic development and energy consumption have strong interactions with each other. Economic development depends strongly on energy in Jilin Province.
Second, energy intensity has decreased with improving energy utility efficiency since 1978. It has been lower than the average for China. From 1979 to 2011, comprehensive energy consumption increased by 53.90×10⁶ tec. An increase of 65.18×10⁶ tec resulted from increased GDP, and an increase of 18.96×10⁶ tec was due to change in industrial structure. In addition, there was a decrease of 30.24×10⁶ tec resulting from an increase in industrial energy intensity. This decomposition analysis indicates that increased industrial energy efficiency contributes to energy savings, while both GDP growth and the change in industrial structure increase energy consumption.
Third, using 2000 as base year, the energy intensity was 1.22 tec/104 yuan in 2011, which was 88% of that in 2000. In addition, the efficiency index and structure index in 2011 were 72% and 121%, respectively, of those in 2000. Hence, improvements in energy utility efficiency will reduce the energy intensity, thus increasing energy-saving profits.
Fourth, changes in both comprehensive energy intensity and hydroelectricity energy intensity were related to the dynamics of industrial structure during the same time period. The change in the petroleum energy intensity was greater than that in the carbon energy intensity. The decrease in the proportion of agriculture in the economy of the province exerted a positive effect in lowering the energy intensities of comprehensive energy and hydroelectricity, while the decrease in the proportion of industry lowered the energy intensities of carbon and natural gas.

5.2 Discussion

The change in industrial structure did not have a beneficial effect on energy savings in Jilin. Instead, it increased energy consumption. At present, the shares of those sectors with high energy consumption are large, such as transportation equipment manufacture, petrochemicals, pharmaceuticals, building materials, and energy production. As the leading sectors of Jilin, their shares will not be reduced in the near future. In other words, changes in industrial structure to achieve energy savings will be a long-time aim. Hence, coordinated development of an optimized strategy for industry and energy consumption should be promoted. It is necessary to increase the proportion of tertiary industry and lower that of sectors with high energy consumption, to enhance energy utility efficiency.
Enhancing energy utility efficiency is an important approach for reducing energy intensity. Governments should take measures to guide enterprises to develop more energy-saving and high-value-added products. Solutions include increasing financial support, formulating preferential tax policies, and studying the energy price system. At the same time, it is necessary to further enhance industrial concentration and eliminate small, scattered pollution sources based on backward technology, through a combination of administrative, legal, and economic means. The aim is to achieve intensive production and energy utility, while raising awareness among citizens of the need for energy saving. The application of energy-saving solutions through changes in industrial structure together with increases in energy efficiency will help realize the goal of energy conservation and sustainable economic development.
Because of a lack of data, this study was not able to examine the detailed subdivisions of the industrial sector. The relationship between economic growth and energy consumption on the industrial micro-scale warrants further investigation.

The authors have declared that no competing interests exist.

1
Altinay G, Karagol E, 2004. Structural break, unit root, and the causality between energy consumption and GDP in Turkey.Energy Economics, 26(6): 985-994.

2
Ang B W, 2006. Monitoring changes in economy-wide energy efficiency: From energy-GDP ratio to composite efficiency index.Energy Policy, 34(5): 574-582.

3
Ang B W, Zhang F Q, 2000. A survey of index decomposition analysis in energy and environmental studies.Energy, 25(12): 1149-1176.

4
Boy G A, Roop J M, 2004. A note on the Fisher ideal index decomposition for structural change in energy intensity.The Energy Journal, 25(1): 87-101.

5
Buluş A, Topalli N, 2011. Energy efficiency and rebound effect: Does energy efficiency save energy?EPE, 3(3): 355-360, doi: 10.4236/epe.2011.33045.

6
Cao D Y, Zhang L S, Yang S Cet al., 2008. The prediction of medium- and long-term primary energy demand in Hebei Province.China Mining Magazine, 17(8): 28-30. (in Chinese)

7
Chefurka P, 2007a. Energy and GDP in 2050.

8
Chefurka P, 2007b. Energy Intensity and GDP in 2050.

9
GDP_2050.html.

10
Cheng Y, Wang Z, Zhang S, 2013. Spatial econometric analysis of carbon emission intensity and its driving factors from energy consumption in China.Acta Geographica Sinica, 68(10): 1418-1431. (in Chinese)

11
Dixon R K, McGowan E, Onysko Get al., 2010. US energy conservation and efficiency policies: Challenges and opportunities.Energy Policy, 38(11): 6398-6408.

12
Environmental and Energy Study Institute (EESI), 2010. Industrial energy efficiency: Using new technologies to reduce energy use in industry and manufacturing. Eesi.org. www.eesi.org/node/2259.

13
Finemood, 2012in Chinese)

14
Fisher K V, Gary H J, Liu Hongmeiet al., 2004. What is driving China’s decline in energy intensity.Resource and Energy Economics, 26(1): 77-97.

15
Gao T M, 2006. Econometrics Method and Model: Eviews Application and Case Study. Beijing: Tsinghua University Press, 260-278. (in Chinese)

16
General Office of the People’s Government of Jilin Province, 2001-2012. Jilin Yearbook. Changchun: Publishing House. (in Chinese)

17
Gottron F,

18
Greening L A, Greene D L, Difiglio C, 2000. Energy efficiency and consumption: The rebound effect: A survey.Energy Policy, 28(6/7): 389-401, doi: 10.1016/S0301-4215(00)00021-5.

19
Gujarati N D, 2004. Basic Econometrics. Beijing: China Renmin University Press, 25-41.

20
Hu J F, Zhao X L, Ouyang C, 2011. Research on the relationship between energy consumption and economic growth of Beijing.Statistical Research, 28(3): 79-85. (in Chinese)

21
Huesemann M H, Huesemann J A, 2011. Techno-fix: Why technology won’t save us or the environment. In: Search of Solutions II: Efficiency Improvements. Gabriola Island, Canada: New Society Publishers.

22
Jilin Statistical Bureau, 1996-2012. Jilin Statistical Yearbook. Beijing: China Statistics Press.

23
Kraft J, Kraft A, 1978. On the relationship between energy and GNP.Journal of Energy and Development, (3): 401-403.

24
Li J K, 2005. Recycling economy: the strategic choice of the harmonious development of energy consumption and economic growth.Collected Essays on Finance and Economics, 2005, (5): 8-13.

25
Liu L, Shen L, Gao T, 2012. Evaluation and spatial-temporal evolution of energy security in China.Journal of Geographical Sciences, 67(12): 1634-1644, doi: 10.11821/xb201212005.

26
Ma H Y, Oxley L, Gibson J, 2010. China’s energy economy: A survey of the literature.Economic Systems, (34): 105-132. (in Chinese)

27
Manufacturing Institute, 2005. Efficiency and innovation in U.S. manufacturing energy use. Washington: National Association of Manufacturers.

28
Metcalf G E, 2009. An empirical analysis of energy intensity and its determinants at the state level.The Energy Journal, 29(3): 2-26.

29
Qu X E, 2009. An analysis on Chinese inter-provincial differences in energy efficiency and their determinants.Economic Theory and Business Management, 29(2): 46-52. (in Chinese)

30
Shi D, 1999a. Industrial structure change is the major factor to influence the energy consumption of China. China Industrial Economy, (11): 38-43. (in Chinese)

31
Shi D, 1999b. Influence of changes in industry structure on power consumption. The Journal of quantitative and Technical Economics, (12): 50-52. (in Chinese)

32
Shi D, Zhang J L, 2003. Influence of changes in industry structure on power consumption.Economic Theory and Business Management, 23(8): 30-32. (in Chinese)

33
Song F, Wang L L, 2012. An analysis of changing trends in China’s energy intensity and provincial differences.Resources Science, 34(1): 13-19. (in Chinese)

34
Stern D I, 1993. Energy use and economic growth in the USA: A multivariate approach.Energy Economics, 15(2): 137-150.

35
Wang J, He C, 2009. Technological development, structural change and Chinese energy consumption efficiency.China Population, Resources and Environment, 19(2): 157-161. (in Chinese)

36
Wang Q, Zhou D, Shen Xet al., 2010. The measurement and analysis of total factor energy efficiency in China.Management Review, 22(3): 37-43. (in Chinese)

37
Wei C, Shen M, 2009. Current progresses and new trend of research on energy efficiency: A literature review.Journal of Zhejiang University: Humanities and Social Sciences, 39(3): 55-63. (in Chinese)

38
Woolf T, Lutz E D, 1993. Energy efficiency in Britain creating profitable alternatives.Utilities Policy, 3(3): 233-242.

39
Wu Q, Cheng J, Wang H, 2005. Change of energy consumption with the process of industrialization in China.China Industrial Economy, (4): 30-37. (in Chinese)

40
Xu B, Liu F, 2004. Impact of changes in industry structure on power consumption. Journal of Liaoning Technical University (Social Science Edition), 6(5): 499-501. (in Chinese)

41
Yu S H, Choi J Y, 1985. The causal relationship between energy and GDP: an international comparison.Energy Development, (10): 249-272.

42
Yu S H, Jin J C, 1992. Cointegration tests of energy consumption, income and employment.Recourses Energy, 14(3): 259-266.

43
Zhang J W, Gong X G, 2010. Impact of industrial structure on the energy consumption: A case of Hebei Province. Journal of Yanshan University (Philosophy and Social Science Edition), 11(1): 106-110. (in Chinese)

44
Zhang X P, 2008. Regional disparities in energy consumption intensity in China and determining factors. Resources Science, 30(6): 883-889. (in Chinese)

45
Zhang X T, 2007. Guide to Eviews and Case Study. Beijing: China Machine Press, 118-122. (in Chinese)

46
Zhang Z X, 2003. Why did energy intensity fall in China’s industrial sector in the 1990s? The relative importance of structural change and intensity change.Energy Economics, 25(6): 625-638.

47
Zhao J, Yan X, Jia G, 2012. Simulating net carbon budget of forest ecosystems and its response to climate change in northeastern China using improved FORCCHN.Chinese Geographical Science, 22(1): 29-41, doi: 10.1007/s11769-012-0512-6.

48
Zhou P, Ang B W, 2008. Linear programming models for measuring economy-wide energy efficiency performance.Energy Policy, 36(8): 2911-2916.

Outlines

/