
Journal of Geographical Sciences >
Quantitative measuring and influencing mechanism of urban and rural land intensive use in China
*Corresponding author: Fang Chuanglin (1966-), Professor, E-mail: fangcl@igsnrr.ac.cn
Author: Li Guangdong (1986-), PhD, specialized in land use and land cover change (LUCC), urban geography, and urban & regional planning. E-mail: ligd.11b@igsnrr.ac.cn
Received date: 2014-01-20
Accepted date: 2014-02-20
Online published: 2014-05-20
Supported by
The National Science and Technology Support Planning, No.2012BAJ22B03
Copyright
Land use issue is an important constraining force to limit economic sustainable development of China. Urban and rural rapid expansion depletes valued land resources under the background of rapid urbanization. An extensive use pattern might cause a serious waste of land resources. The study on influencing mechanism of land intensive use (LIU) in China at the county level is a key tool for effective LIU practice and policy-making. This paper uses OLS model, Spatial Panel Lagged model and Spatial Panel Error model to quantitatively analyze the influencing mechanisms of five class factors and 17 variables supported by GIS (Geographic Information System) and MATLAB. And a comprehensive data set was developed including physical geography and socio-economic information of 2286 counties. Meanwhile, the spatiotemporal pattern of LIU has discussed by means of GIS. The results show that Spatial Panel Data models are slightly superior to OLS model in terms of significance and confidence level. Regression results of these models indicate that industrialization, urbanization, economic development level, location, transportation and policy have significant impact on LIU of counties. The variables of physical geography are less significant than socio-economic variables. An ignored variable of historical factor, however, became the best significant factor. In the future, the LIU at the county level should take advantage of the new situation by enhancing favorable factors and reducing disadvantageous ones, which can be acquired by improving the entire level and quality of industrialization and urbanization. We argued that an efficient and complete land market and operating system should be built to reflect market-oriented activities at the first place, then, differential LIU regulation policies and measurements should be optimized according to regional differences. In the meantime, we should pay close attention to the carrying capacity of local resources and environments when conducting LIU practices.
LI Guangdong , FANG Chuanglin , PANG Bo . Quantitative measuring and influencing mechanism of urban and rural land intensive use in China[J]. Journal of Geographical Sciences, 2014 , 24(5) : 858 -874 . DOI: 10.1007/s11442-014-1125-z
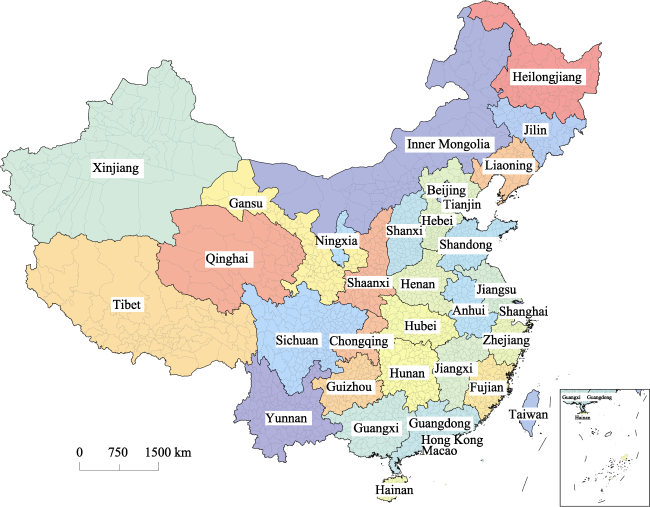
Figure 1 Administrative divisions of China at the county level |
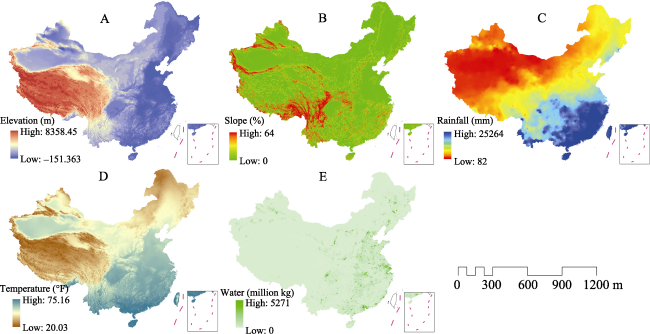
Figure 2 Maps of environmental factors of counties in China |
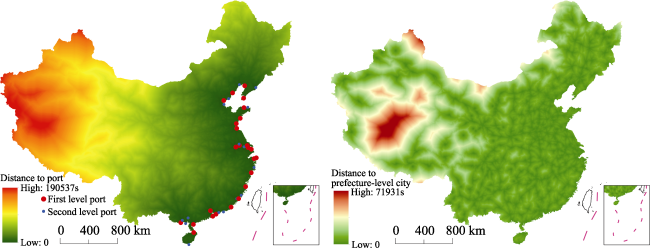
Figure 3 Maps of locational factors of counties in China |
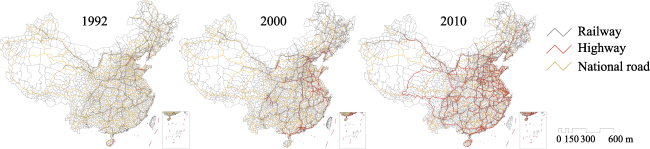
Figure 4 Spatial inequality of road network in China |
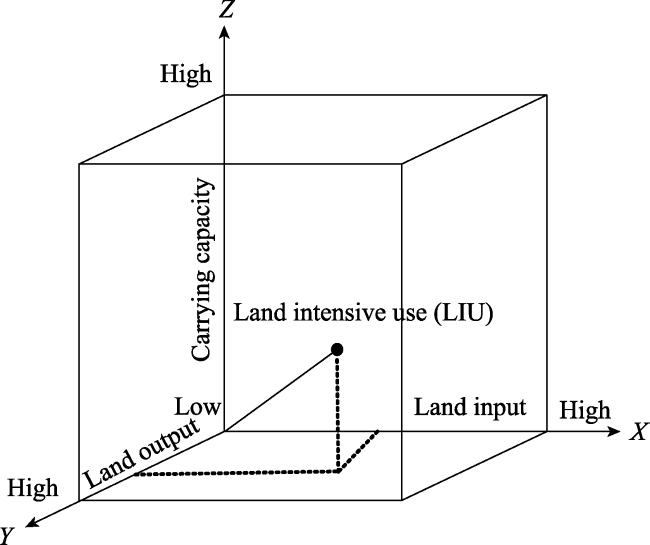
 ) that is a geometric sum of land input vector, land output vector and land carrying capacity vector (
  ,
,  and
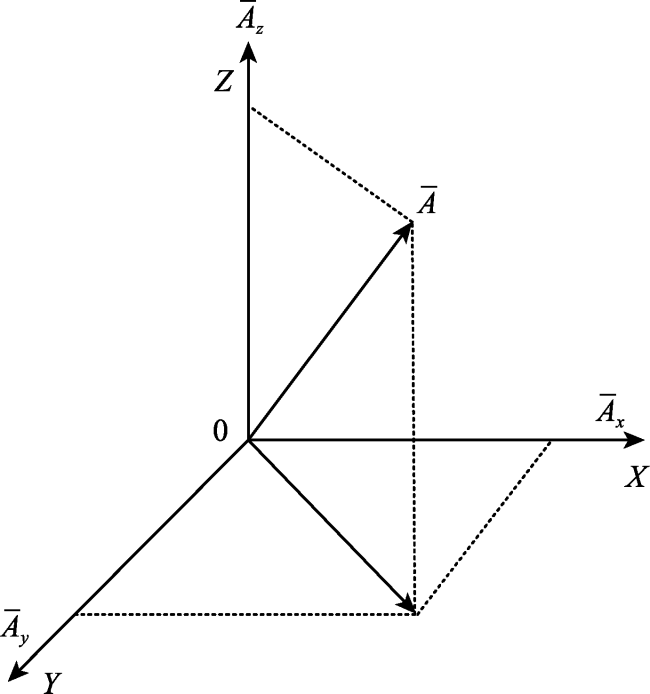
and  ) in a three-dimensional Cartesian Coordinates System (Figure 6). According to vector algorithm,
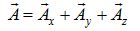
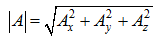
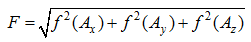
Figure 5 3D model of land intensive use |
Figure 6 Vector analysis of land intensive use |
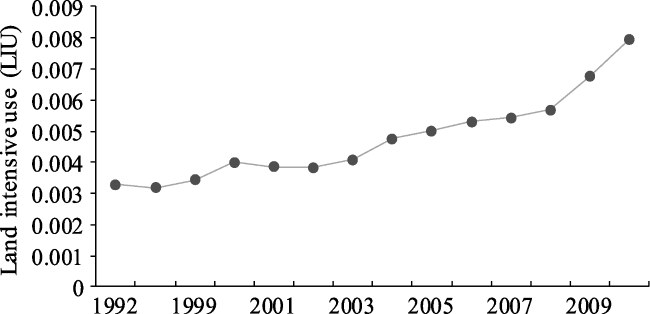
Figure 7 Temporal variation of land intensive use at the county level in China |
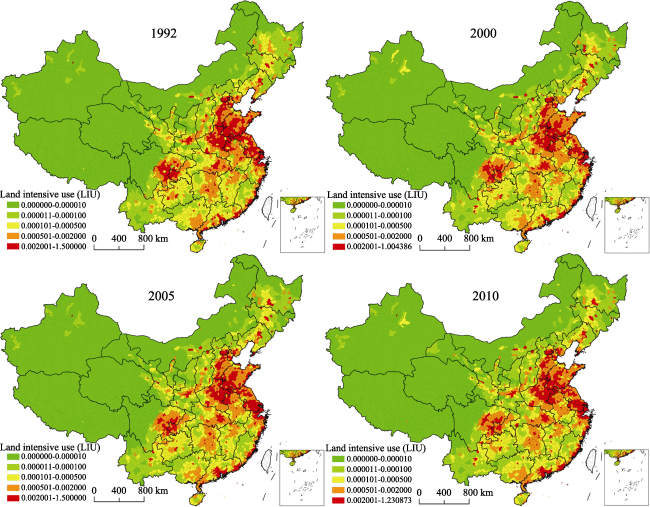
Figure 8 Spatial distribution of LIU at the county level in China |
Table 1 Preliminary analysis of influencing factors for land intensive use at the county level |
| Variable category | Variable name | Description | Impact |
|---|---|---|---|
| Dependent variable | LIU | Land intensive use level | |
| Socio-economic factors | LNGDP | Constant GDP per capita | + |
| LNPOP | Population growth | + | |
| IND | Share of the output value of the secondary industry in GDP | + | |
| URBAN | Share of non-agricultural population in total population | + | |
| Environmental factors | LNELV | Average elevation | - |
| LNSLOPE | Average slope | - | |
| LNRAI | Average rainfall | + | |
| LNTEM | Average temperature | ? | |
| LNWATER | Water resources utilization | + | |
| Transportation and locational factors | LNDIST_PORT1 | Distance to the nearest first level ports | - |
| LNDIST_PORT2 | Distance to the nearest second level ports | - | |
| LNDIST_CITY | Distance to the nearest prefecture-level cities | - | |
| LNTRAN_DENS | Railway, highway and national road density | + | |
| REG | Regional dummy variables | + | |
| CITY_COUNTY | City and county dummy variable (1 or 0) | + | |
| Policy factors | POLICY | Strategic preferential policy | + |
| State-level economic and technical development zones | + | ||
| Location in country’s urban system and development orientation for Development Priority Zones | + | ||
| Historical factor | LIU_A0 | The base year is 1992 | + |
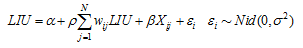
 is the distributed error term; β is the influencing coefficient; Xij is independent
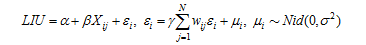
Table 2 Quantitative analysis results of influencing factors for land intensive use at the county level |
| (1) | (2) | (3) | (4) | (5) | |
|---|---|---|---|---|---|
| OLS | SAR fixed space and time period (ML) | SAR fixed time period (ML) | SEM fixed space and time period (ML) | SEM fixed time period (ML) | |
| α | -0.001493*** | ||||
| (-2.6120) | |||||
| LNGDP | 0.000138*** | 0.000453*** | 0.000459*** | ||
| (2.1139) | (7.5172) | (7.5232) | |||
| LNPOP | -0.000148 | -0.000179 | -0.000165 | ||
| (-0.9617) | (-1.3779) | (-1.2498) | |||
| IND | 0.001056*** | 0.002470*** | 0.001763*** | ||
| (3.2009) | (8.8279) | (3.4884) | |||
| URBAN | 0.002233*** | 0.005983*** | 0.002536*** | ||
| (7.4161) | (3.5428) | (9.3160) | |||
| POLICY | 0.000251*** | 0.000551*** | 0.000561*** | ||
| (8.5146) | (8.7210) | (8.7705) | |||
| LNELV | -0.000167*** | -0.000144*** | -0.000168*** | ||
| (-4.7297) | (-4.0509) | (-4.6797) | |||
| LNSLOPE | -0.000062*** | -0.000059** | -0.000063*** | ||
| (-2.6428) | (-2.5075) | (-2.6210) | |||
| LNRAI | 0.000131 | 0.000127 | 0.000132 | ||
| (1.6255) | (1.4923) | (1.5947) | |||
| LNTEM | 0.000056 | 0.000052** | 0.000056 | ||
| (1.5794) | (2.0475) | (1.5465) | |||
| LNWATER | 0.000005*** | 0.000005*** | 0.000005*** | ||
| (5.9565) | (16.2101) | (15.2856) | |||
| LNDIST_PORT1 | -0.000101** | -0.000093*** | -0.000101* | ||
| (-1.9987) | (-2.7832) | (-1.9835) | |||
| LNDIST_PORT2 | -0.000065** | -0.000060*** | -0.000065* | ||
| (-1.5784) | (-2.1576) | (-1.5756) | |||
| LNDIST_CITY | -0.000106*** | -0.000095** | -0.000105* | ||
| (-1.7944) | (-2.1448) | (-1.7667) | |||
| LNTRAN_DENS | 0.000076*** | 0.000419*** | 0.000075*** | ||
| (4.1285) | (6.5455) | (4.1050) | |||
| REG | 0.000171* | 0.000156*** | 0.000172** | ||
| (2.5522) | (2.3459) | (2.5190) | |||
| CITY_COUNTY | 0.000682*** | 0.000674*** | 0.000681*** | ||
| (5.5233) | (5.4681) | (5.4984) | |||
| LIU_A0 | 1.002834*** | 0.760664*** | 1.004324*** | 0.760664*** | 1.002239*** |
| (758.0175) | (191.7858) | (770.4556) | (191.7857) | (762.4691) | |
| ρ | 0.006915*** | 0.006917*** | |||
| (5.7392) | (5.7393) | ||||
| γ | 0.021971*** | 0.025973*** | |||
| (15.1074) | (16.1554) | ||||
| Rbar2 | 0.9537 | 0.9584 | 0.9534 | 0.9584 | 0.9536 |
| σ2 | 0.0001 | 0.0001 | 0.0001 | 0.0001 | 0.0001 |
| LM lag | 3736.5680*** | ||||
| LM err | 2200.3740*** | ||||
| R-LM lag | 1755.2066*** | ||||
| R-LM err | 219.0127*** | ||||
| Durbin-Watson | 2.0005 | ||||
| Log-likelihood | 96323 | 99113 | 96300 | 99114 | 96272 |
T values are in parentheses ***significant at 1% confident level, **significant at 5% confident level, * significant at 1% confident level. |
The authors have declared that no competing interests exist.
| 1 |
|
| 2 |
|
| 3 |
|
| 4 |
|
| 5 |
|
| 6 |
|
| 7 |
|
| 8 |
|
| 9 |
|
| 10 |
|
| 11 |
|
| 12 |
|
| 13 |
|
| 14 |
|
| 15 |
|
| 16 |
|
| 17 |
|
| 18 |
|
| 19 |
Rural Secretary of National Bureau of Statistics of China (RSNBS), 2008-2012. China Yearbook of Town Survey. Beijing: China Statistics Press. (in Chinese)
|
| 20 |
|
| 21 |
|
| 22 |
Urban Secretary of National Bureau of Statistics of China (USNBS), 1985-2012. China City Statistical Yearbook. Beijing: China Statistics Press. (in Chinese)
|
| 23 |
|
| 24 |
|
| 25 |
|
| 26 |
|
| 27 |
|
| 28 |
|
/
| 〈 |
|
〉 |