
Journal of Geographical Sciences >
Increasing free-air 0℃ isotherm height in Southwest China from 1960 to 2010
Author: Zhang Mingjun (1975-), Professor, specialized in global climate change and glaciology. E-mail: mjzhang2004@163.com
Received date: 2014-01-20
Accepted date: 2014-02-21
Online published: 2014-05-20
Supported by
National Basic Research Program of China (973 Program), No.2013CBA01801.National Natural Science Foundation of China, No.41161012
Copyright
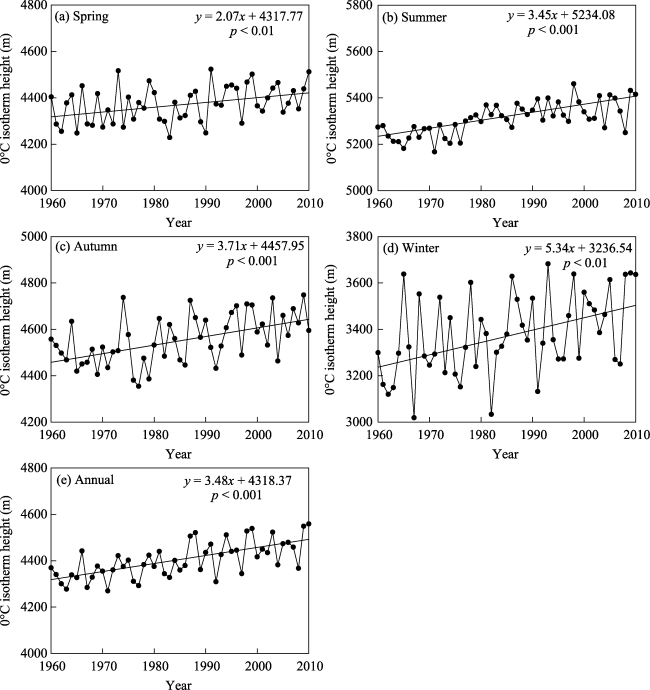
Based on the radiosonde data observed at 14 stations in Southwest China from 1960 to 2010, as well as the corresponding surface air temperature, the long-term change of free-air 0℃ isotherm height in Southwest China and the relationships between surface air temperature and 0℃ isotherm height are discussed. The results indicated that the spatial distribution of 0℃ isotherm height is generally related with latitude, but the huge massif or plateau may complicate the latitude pattern. The two main regimes influencing the spatial patterns of 0℃ isotherm height in Southwest China are latitude and huge massif. The annual 0℃ isotherm height has increased by 35 m per decade in the recent decades, which is statistically significant at the 0.001 level. Generally, the increasing trend can be examined for each seasonal series, especially in winter (53 m per decade). The diversity of trend magnitudes for annual and seasonal series can also be detected at a spatial view, but generally 0℃ isotherm height correlated well with surface air temperature.
Key words: Southwest China; 0℃ isotherm height; global warming; radiosonde data
ZHANG Mingjun , DONG Lei , WANG Shengjie , ZHAO Aifang , QIANG Fang , SUN Meiping , WANG Qiong . Increasing free-air 0℃ isotherm height in Southwest China from 1960 to 2010[J]. Journal of Geographical Sciences, 2014 , 24(5) : 833 -844 . DOI: 10.1007/s11442-014-1123-1
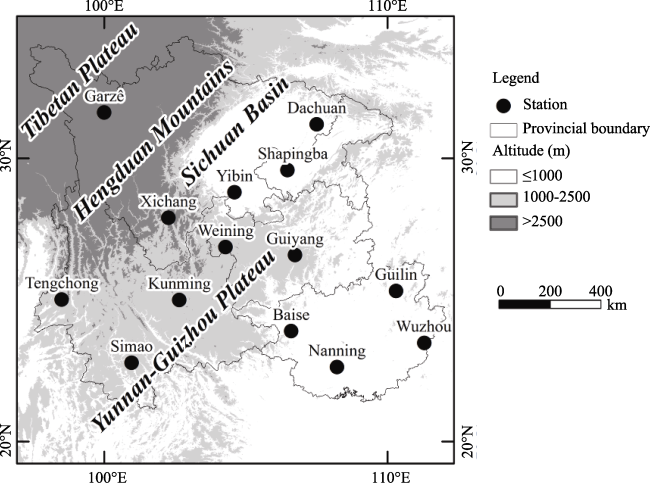
Figure 1 Location of radiosonde stations in Southwest China |
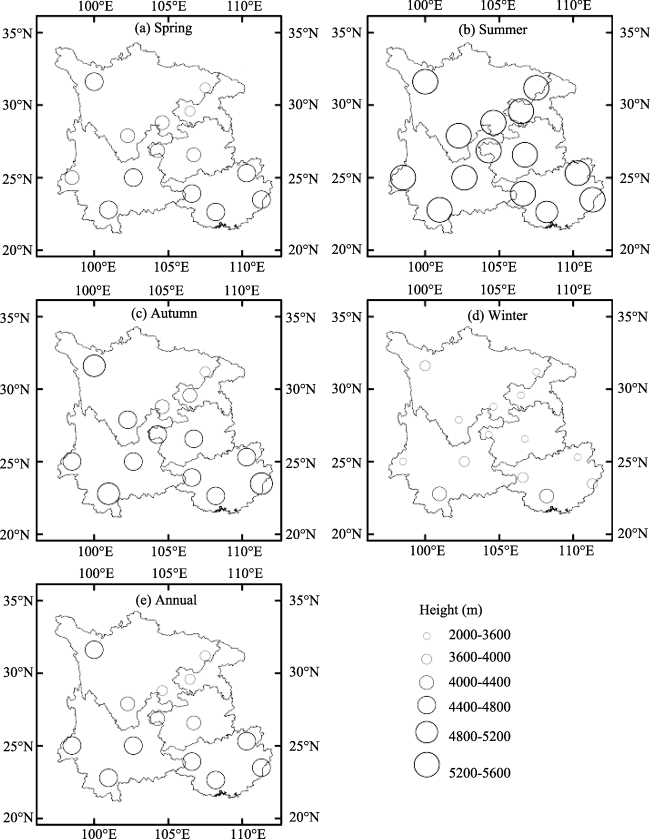
Figure 2 Spatial distribution of seasonal/annual 0℃ isotherm height in Southwest China during 1960-2010 |
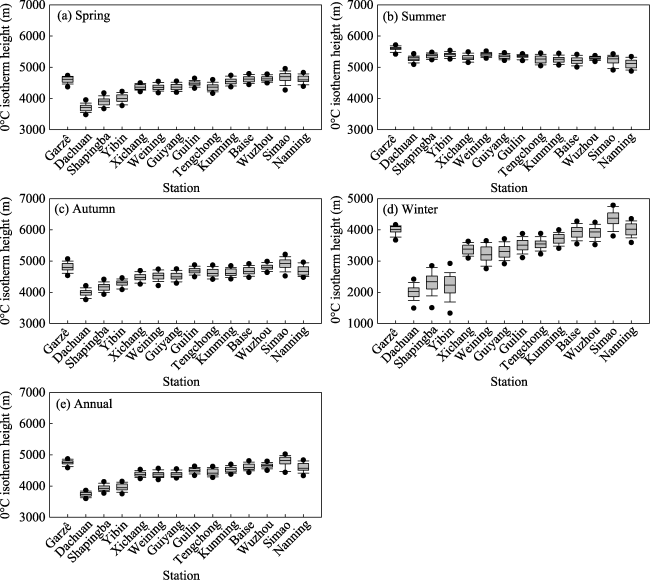
Figure 3 Box plot of seasonal/annual 0℃ isotherm height in Southwest China during 1960-2010 |
Table 1 Decadal anomalies of 0℃ isotherm height in Southwest China during 1960-2010 |
| Decade | 0℃ isotherm height anomalies (m) | ||||||||||||||
|---|---|---|---|---|---|---|---|---|---|---|---|---|---|---|---|
| Spring | Summer | Autumn | Winter | Annual | |||||||||||
| 0:00 | 12:00 | Ave. | 0:00 | 12:00 | Ave. | 0:00 | 12:00 | Ave. | 0:00 | 12:00 | Ave. | 0:00 | 12:00 | Ave. | |
| 1960-1969 | -30 | -31 | -31 | -48 | -93 | -70 | -55 | -70 | -62 | -108 | -85 | -94 | -56 | -66 | -64 |
| 1970-1979 | -13 | -10 | -11 | -53 | -51 | -52 | -70 | -67 | -68 | -64 | -40 | -53 | -48 | -40 | -43 |
| 1980-1989 | -35 | -30 | -31 | 25 | 20 | 22 | 16 | 12 | 14 | -3 | 4 | 1 | -3 | -2 | -1 |
| 1990-1999 | 41 | 37 | 39 | 50 | 54 | 52 | 46 | 44 | 45 | 34 | 1 | 7 | 47 | 36 | 42 |
| 2000-2010 | 34 | 31 | 33 | 24 | 64 | 44 | 57 | 74 | 65 | 124 | 110 | 117 | 54 | 65 | 60 |
Figure 4 Variation of seasonal/annual 0℃ isotherm height in Southwest China during 1960-2010 |
Table 2 Trend magnitude of seasonal/annual 0℃ isotherm height in Southwest China during 1960-2010 |
| Spring | Summer | Autumn | Winter | Annual | ||||||
|---|---|---|---|---|---|---|---|---|---|---|
| Trend (m/a) | Sig. | Trend (m/a) | Sig. | Trend (m/a) | Sig. | Trend (m/a) | Sig. | Trend (m/a) | Sig. | |
| 0:00 | 2.1 | <0.01 | 2.7 | <0.001 | 3.3 | <0.01 | 6.3 | <0.01 | 3.3 | <0.01 |
| 12:00 | 2.0 | <0.01 | 4.2 | <0.001 | 4.0 | <0.001 | 4.7 | <0.01 | 3.5 | <0.001 |
| Ave. | 2.1 | <0.01 | 3.5 | <0.01 | 3.7 | <0.001 | 5.3 | <0.01 | 3.5 | <0.001 |
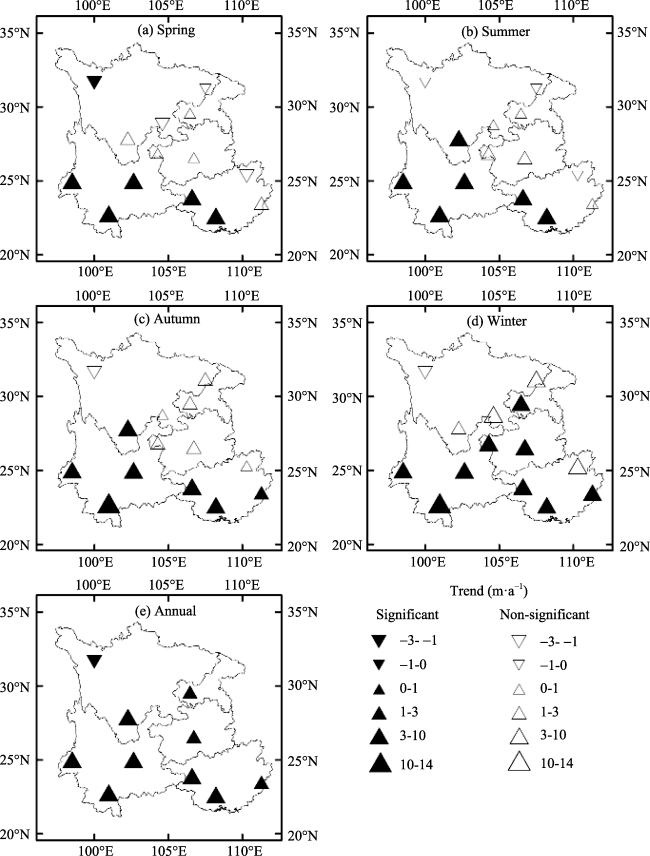
Figure 5 Spatial distribution of trend magnitude in 0℃ isotherm height in Southwest China during 1960-2010 |
Table 3 Trend magnitude in seasonal/annual 0℃ isotherm height for each station in Southwest China during 1960-2010 |
| Trend magnitude (m/a) | |||||||||||||||
|---|---|---|---|---|---|---|---|---|---|---|---|---|---|---|---|
| Spring | Summer | Autumn | Winter | Annual | |||||||||||
| 0:00 | 12:00 | Ave | 0:00 | 12:00 | Ave | 0:00 | 12:00 | Ave | 0:00 | 12:00 | Ave | 0:00 | 12:00 | Ave | |
| Garzê | -1.4 | -2.9** | -2.2* | -0.6 | -0.8 | -0.5 | -1.5 | -2.5 | -2.3 | -1.9 | -2.1 | -1.6 | -1.8 | -2.2** | -1.8* |
| Dachuan | 0.5 | -1.5 | -0.4 | -0.3 | 0.0 | -0.2 | 1.5 | 0.9 | 1.1 | -1.8 | 8.4** | 3.6 | -0.6 | 1.4 | 0.2 |
| Shapingba | -0.2 | 0.7 | 0.2 | 0.3 | 1.4 | 0.9 | 1.51 | 2.7* | 2.1 | 10.4** | 8.2** | 9.5** | 2.0 | 2.6* | 2.0* |
| Yibin | -3.8* | -0.4 | -2.2 | -5.0*** | 5.7*** | 0.5 | -1.0 | 2.2* | 0.6 | 14.6*** | -3.0 | 6.2 | 0.4 | 0.4 | 0.3 |
| Xichang | 0.7 | 2.0** | 1.4 | 2.5** | 8.40*** | 5.6*** | 1.6 | 4.0*** | 3.0* | 2.5 | 2.2 | 2.4 | 1.7 | 4.3*** | 3.2*** |
| Weining | -0.1 | 0.3 | 0.3 | 0.6 | 1.2 | 1.0 | 1.6 | 1.7 | 1.6 | 7.1* | 6.0* | 6.4* | 1.8 | 2.2* | 2.0 |
| Guiyang | -0.5 | 0.9 | 0.2 | -0.5 | 2.8*** | 1.1 | 1.0 | 2.6* | 1.8 | 5.3* | 4.7* | 5.4* | 0.9 | 2.9** | 1.9* |
| Guilin | -0.6 | -2.5** | -1.7 | 0.3 | -2.3*** | -1.0 | 1.3 | 0.5 | 0.7 | 4.6* | 2.8 | 3.8 | 1.0 | -0.7 | 0.7 |
| Tengchong | 3.4** | 7.3*** | 5.4*** | 2.0** | 13.0*** | 7.5*** | 3.5** | 11.2*** | 7.3*** | 6.4*** | 5.0*** | 5.8*** | 3.9*** | 9.1*** | 6.6*** |
| Kunming | 9.9*** | -0.9 | 4.7*** | 12.3*** | 0.2 | 6.3*** | 9.1*** | 0.6 | 4.8*** | 6.4*** | 1.9 | 4.0* | 9.6*** | 0.2 | 5.0*** |
| Baise | 2.8*** | 6.7*** | 4.8*** | 4.4*** | 9.7*** | 7.1*** | 4.3*** | 8.9*** | 6.6*** | 4.5* | 7.6*** | 6.0** | 3.9*** | 8.3*** | 6.0*** |
| Wuzhou | 1.19 | 1.3 | 1.4 | -0.2 | 1.6* | 0.7 | 2.5* | 3.3*** | 2.8** | 4.9* | 4.7* | 4.7* | 1.7* | 2.6*** | 2.1** |
| Simao | 12.9*** | 6.0*** | 9.3*** | 13.9*** | 3.2*** | 8.6*** | 15.2*** | 5.5*** | 10.4*** | 16.0*** | 9.5*** | 12.8*** | 14.1*** | 5.8*** | 9.7*** |
| Nanning | 3.72*** | 10.48*** | 7.11*** | 5.34*** | 13.66*** | 9.46*** | 4.75*** | 12.56*** | 8.89*** | 6.32** | 12.27*** | 9.32*** | 4.71*** | 12.06*** | 8.84*** |
Note: *, **, and *** denote statistically significant at the 0.05, 0.01, and 0.001 levels, respectively. |
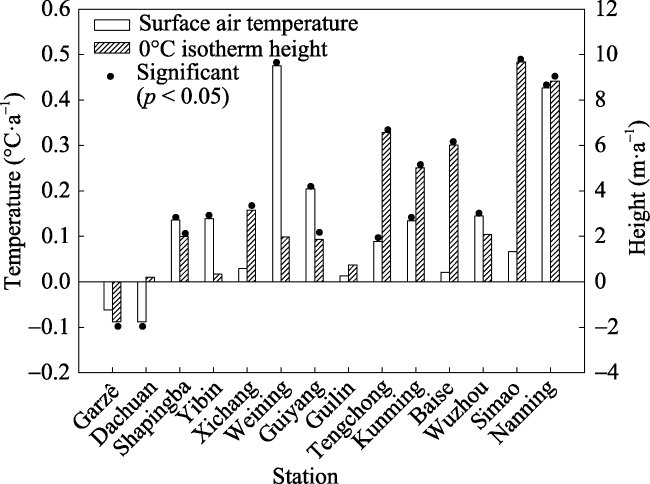
Figure 6 Trend magnitudes of surface air temperature and 0℃ isotherm height in Southwest China during 1960-2010 |
The authors have declared that no competing interests exist.
| 1 |
|
| 2 |
|
| 3 |
|
| 4 |
|
| 5 |
|
| 6 |
|
| 7 |
|
| 8 |
|
| 9 |
|
| 10 |
|
| 11 |
|
| 12 |
|
| 13 |
|
| 14 |
|
| 15 |
|
| 16 |
|
| 17 |
|
| 18 |
|
| 19 |
|
| 20 |
|
| 21 |
|
| 22 |
|
| 23 |
|
| 24 |
|
| 25 |
|
| 26 |
|
| 27 |
|
| 28 |
|
| 29 |
|
| 30 |
|
| 31 |
|
| 32 |
|
| 33 |
|
/
| 〈 |
|
〉 |