Research Articles

The effect of environmental factors on spatial variability in land use change in the high-sediment region of China’s Loess Plateau

  • LUO Ya , 1, 2 ,
  • YANG Shengtian 1 ,
  • ZHAO Changsen , 1, * ,
  • LIU Xiaoyan 3 ,
  • LIU Changming 4, 5 ,
  • WU Linna 1, 6 ,
  • ZHAO Haigen 1 ,
  • ZHANG Yichi 1
Expand
  • 1. State Key Laboratory of Remote Sensing Science, School of Geography, Beijing Normal University, Beijing Key Laboratory for Remote Sensing of Environment and Digital Cities, Beijing 100875, China
  • 2. School of Geographic and Environmental Sciences, Guizhou Normal University, Guiyang 550001, China
  • 3. Yellow River Conservancy Commission, Zhengzhou 450003, China
  • 4. College of Water Science, Beijing Normal University, Beijing 100875, China
  • 5. Key Laboratory of Land Water Cycle and Surface Processes, CAS, IGSNRR, CAS, Beijing 100101, China
  • 6. College of Resource and Environment Engineering, Guizhou University, Guiyang 550025, China

*Corresponding author: Zhao Changsen (1977-), PhD, specialized in application of RS in water resources and water environment. E-mail:

Author: Luo Ya (1979-), Associate Professor, specialized in LUCC and soil erosion. E-mail:

Received date: 2013-12-08

  Accepted date: 2014-04-20

  Online published: 2014-05-20

Supported by

National Key Technologies R&D Program, No.2012BAB02B00.Public Welfare Foundation of the Ministry of Water Resources of China, No.201101037.The Fundamental Research Funds for the Central Universities

Copyright

Journal of Geographical Sciences, All Rights Reserved

Abstract

In areas with topographic heterogeneity, land use change is spatially variable and influenced by climate, soil properties, and topography. To better understand this variability in the high-sediment region of the Loess Plateau in which soil loss is most severe and sediment diameter is larger than in other regions of the plateau, this study builds some indicators to identify the characteristics of land use change and then analyze the spatial variability as it is affected by climate, soil property, and topography. We build two indicators, a land use change intensity index and a vegetation change index, to characterize the intensity of land use change, and the degree of vegetation restoration, respectively. Based on a subsection mean method, the two indicators are then used to assess the spatial variability of land use change affected by climatic, edaphic, and topographic elements. The results indicate that: 1) Land use changed significantly in the period 1998-2010. The total area experiencing land use change was 42,302 km2, accounting for 22.57%of the study area. High-coverage grassland, other woodland, and forest increased significantly, while low-coverage grassland and farmland decreased in 2010 compared with 1998. 2) Land use change occurred primarily west of the Yellow River, between 35 and 38 degrees north latitude. The four transformation types, including (a) low-coverage grassland to medium-coverage grassland, (b) medium-coverage grassland to high-coverage grassland, (c) farmland to other woodland, and (d) farmland to medium-coverage grassland, were the primary types of land use change, together constituting 60% of the area experiencing land use change. 3) The spatial variability of land use change was significantly affected by properties of dryness/wetness, soil conditions and slope gradient. In general, land use changed dramatically in semi-arid regions, remained relatively stable in arid regions, changed significantly in clay-rich soil, remained relatively stable in clay-poor soil, changed dramatically in steeper slopes, and remained relatively stable in tablelands and low-lying regions. The increase in vegetation coincided with increasing changes in land use for each physical element. These findings allow for an evaluation of the effect of the Grain to Green Program, and are applicable to the design of soil and water conservation projects on the Loess Plateau of China.

Cite this article

LUO Ya , YANG Shengtian , ZHAO Changsen , LIU Xiaoyan , LIU Changming , WU Linna , ZHAO Haigen , ZHANG Yichi . The effect of environmental factors on spatial variability in land use change in the high-sediment region of China’s Loess Plateau[J]. Journal of Geographical Sciences, 2014 , 24(5) : 802 -814 . DOI: 10.1007/s11442-014-1121-3

1 Introduction

The Loess Plateau of China is the main source of the Yellow River sediment. The plateau has a fragile ecology and suffers severe soil loss. This study focuses on the high-sediment region of the Loess Plateau in which soil loss is most severe and sediment diameter is larger than in other regions of the plateau. Significant changes in land use have occurred in this region since the Grain to Green Program (GTGP) launched in 1999 (Pei et al., 2003; Li et al., 2007; Fu et al., 2011). Accompanied by this rapid change, the soil organic carbon and labile organic carbon stores changed (Zhang et al., 2012), and water yield reductions on many of the branches of the Yellow River have also been observed (et al., 2012; Xin et al., 2012). The more that is known about this land use change, the more its relationship to eco-hydrological variations in the region can be understood.
There is a close relationship between environmental factors and land use change (Chen et al., 2001; Fu et al., 2006), and environmental factors are more influential in areas with greater topographic heterogeneity (Opršal et al., 2013). Among the factors, climate, soil properties, and topography would be expected to affect land use change on the Loess Plateau, an area with high topographic heterogeneity.
Studying the spatial variability of land use change affected by environmental factors may be helpful for an evaluation of the effect of soil and water conservation. To date, scholarly attention has focused on the spatial variation of land use change and its possible influences (Li et al., 2009; Zhang et al., 2008). These studies carefully analyzed the changes in areas of all land use types, and their effect on water yield. Studies have rarely simultaneously focused on the spatial variability of land use change as it is affected by climatic, edaphic, and topographic elements, however, this spatial variability clearly merits further research.
This study has two primary objectives. First, we build two indicators, a land use change intensity index and a vegetation change index, to characterize the intensity of land use changes, and the degree of vegetation restoration, respectively. Second, the two indicators, from macroscopic to microcosmic, are used to analyze the spatial variability of land use change affected by environmental factors, including climatic (indicated by dryness/wetness), edaphic (indicated by soil texture), and topographic (indicated by slope gradient) elements on the Loess Plateau in the period 1998-2010.

2 Description of study area

The high-sediment region of the Loess Plateau is the primary sediment source of the Yellow River (Figure 1), and is located at the junction of Shaanxi, Shanxi, Inner Mongolia, Ningxia, and Gansu. It is situated between 103°57′1″E to 112°39′50″E and 34°12′35″N to 40°36′46″N, encompassing 187,422 km2, with an elevation ranging from 388 to 3747 m above sea level. The area is characterized by dramatic spatial variation; its gully density is 2-5 km/km2. Average annual precipitation varies from 300 to 650 mm. Nearly 80% of the precipitation is dominated by rainstorms that occur during the rainy season, from June to September. Approximately 90% of the area is covered by loess, with severe soil loss.
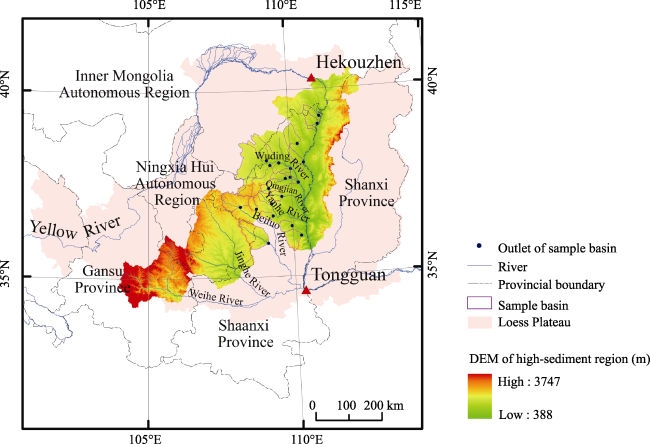
Figure 1 Location of the study area

3 Methodology

3.1 Two indicators that characterize land use change

Accurate data on the intensity of land use change and the effect of environmental restoration are useful in an evaluation of the trends and consequences of land use change. The study thus uses two indicators to characterize the intensity of land use change and the effect of environmental restoration, respectively.
(1) Land use change intensity index
The land use change intensity index (D) was used to characterize its intensity. For a given region, the value of D was calculated as the area of land use change divided by the total area of a region:
D = A/S × 100% (1)
where D is the land use change intensity index ranging from 0 to 1, in %; A is the area of land use change, in km2; S is the total area of the region, in km2. The higher the value of D, the more intense the land use change is in a given region, and vice versa.
(2) Vegetation change index
Vegetation is an important indicator of the effect of environmental restoration. The vegetation change index (I) was used to characterize the degree of vegetation restoration. For a given region, the values of I are obtained from the following formula:
I = R2010 - R1998 (2)
where I is the vegetation change index, in %; R1998 and R2010 are the percentage of vegetation in 1998 and 2010, respectively. The area of vegetation was obtained from the land use map, and equals numerically the sum of forest, shrub, high-coverage grassland, and medium-coverage grassland. If the value of I is greater than 0, it shows that vegetation increased. The greater the value of I, the faster the vegetation increased. If the value of I is less than 0, it shows that vegetation decreased. The greater the absolute value of I, the faster the vegetation decreased. If the value of I equals 0, it shows that the vegetation was unchanged.

3.2 Land use information extraction and validation

In order to record land use change in the period 1998-2010, we interpreted 30 m resolution satellite images (Landsat-5TM in 1998 and HJ-CCD in 2010).Based on the land use classification standard of China (GB/T21010-2007), land use was classified into 11 types, including farmland, forest, shrub, open woodland, other woodland, high-coverage grassland, medium-coverage grassland, low-coverage grassland, water body, construction land, and unused land. Using the man-machine interactive visual interpretation technique (Yang and Zhu, 2000), land use raster datasets in 1998 and 2010 were obtained.
Three field verifications were carried out to assess the accuracy of the interpretation of the land use data. Nearly 32% of the survey area was verified. For the 2010 land use data, interpretation accuracy was assessed by visual verification. The results confirmed that 121 out of 129 points were correctly interpreted in 2010, with an accuracy of 93.8%. For the 1998 land use data, multiple sources of information and multidisciplinary expertise were used to assess the interpretation accuracy, including referencing historical documents and maps and interviewing local residents. The results showed that 118 out of 129 points were correctly interpreted in 1998, with an accuracy of 91.47%.

3.3 Dryness/wetness identification

In order to characterize the spatial variability of land use change that is affected by climate, the aridity index (K) was used to identify the dryness/wetness of a region based on annual precipitation and evaporation in the period 1971-2010 at 104 weather stations. The aridity index was estimated using the following formula (Yang et al., 2002; Mao et al., 2011):
where K is the aridity index; P is annual precipitation, in mm; E is annual evaporation, in mm. A region can be classified into three types: humid (K is greater than 0.5), semi-arid (K ranges from 0.2 to 0.5), and arid (K is less than 0.2).

3.4 Soil texture identification

As a fundamental soil property, texture affects many other basic physical and chemical characteristics. Clays are typically the most important mineral constituents of soils. Because of their small size, the small clay particles with their large specific surface area are most important in determining the fundamental properties of soil (Balba, 1995). The clay ratio of soil can be used to identify soil texture. In this study, the (sand+silt)/clay ratio (Bouyoucos, 1935) was used to represent the clay ratio for purposes of identifying soil texture. Based on the Chinese 1:1,000,000 scale soil map, soil property information was obtained. Three soil textures could then be classified using the international classification system: loam or sand ((sand+silt)/clay ratio more than 5.67 or clay ratio less than 15%), clay loam ((sand+silt)/clay ratio ranging from 3 to 5.67 or clay ratio ranging from 15% to 25%), and clay ((sand+silt)/clay ratio less than 3 or clay ratio more than 25%).

3.5 Slope gradient classification

Global Digital Elevation Model (GDEM) data at a resolution of 30 m were used to extract the slope gradient information needed for the study. The slope gradient can be classified into five classes: less than 2°, 2° to 6°, 6° to 15°, 15° to 25°, and greater than 25°.

3.6 Sample region selection

The Grain to Green Program (GTGP) profoundly impacted land use in the high-sediment region of the Loess Plateau (Fu, 2011). Each province implemented GTGP differently because of different strategic goals and development models. In order to eliminate the impact of these varied strategic goals and development models on land use change, the sample region needed to represent as uniform a GTGP implementation background as possible. Among the five provinces involved in the high-sediment region, the vegetation restoration effect of Shaanxi Province was most significant, each area within the province implemented GTGP similarly. We thus selected 21 basins in Shaanxi Province as sample regions (Figure 1).

3.7 Subsection mean method for expressing the relationships between environmental factors and land use change

The relationships between environmental factors and land use change are difficult to express using a linear fitting method because of the complexity of land use change. Accordingly, we propose a subsection mean method to express these relationships. The subsection mean method can be described as follows:
1) Taking a basin as a computing unit, we calculate the means of a) land use change intensity index, b) vegetation change index, c) aridity index, d) (sand+silt)/clay ratio, and e)slope gradient of the 21 basins. Among them, the means of a) and b) represent land use change characteristics, expressed by the dependent variables Y1 and Y2, respectively. The means of c), d) and e) represent environmental factors, expressed by the independent variables X1, X2 and X3, respectively. For each basin, the relationships between environmental factors and land use change can be represented by (X1, Y1), (X1, Y2), (X2, Y1), (X2, Y2), (X3, Y1) and (X3, Y2) coordinate pairs.
2) Independent variables Xi (i=1,2,3) of 21 basins are arranged as a series from small tolarge and then divided into three subsections.
Subsection 1:
Subsection 2:
Subsection 3:
3) The mean of dependent variables (j=1,2; i=1,2,3) corresponding to each subsection of Xi can be found by the following function:
where 
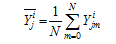
is dependent variables Yj corresponding to Xi; is the mean of dependent variables ; m is the number of the plots (Xi, Yj) for which Xi is included within the range of a given subsection.
4) Last we use to represent the land use change characteristics corresponding to each subsection of environmental properties.

4 Results and discussion

4.1 General characteristics of environmental factors and land use change in the high-sediment region of the Loess Plateau

4.1.1 Spatial variation of environmental factors
The spatial variation of dryness/wetness, soil texture, and slope gradient is shown in Figures 2A and 2B, and Tables 1 and 2. Area and distribution of each environmental factor category are described below.
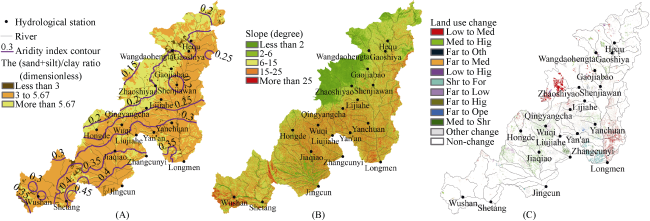
Figure 2 Spatial variation of environmental factors and land use change in the high-sediment region of the Loess Plateau (A) aridity index and the (sand+silt)/clay ratio, (B) slope gradient, (C) land use change in the period 1998-2010. Low=Low-coverage grassland, Med=Medium-coverage grassland, Hig=High-coverage grassland, Far=Farmland, Oth=Other woodland, Shr=Shrub, For=Forest, Ope=Open woodland
1) Dryness/wetness conditions
As shown in Figure 2A and Table 1, the aridity index ranges from 0.15 to 0.45, the areas of aridity index less than 0.2, 0.2-0.5 are 38,545 km2 (20.57% of the study area) and 148,877 km2 (79.43% of the study area), respectively. Arid climate (aridity index less than 0.2) is primarily distributed west of the Zhaoshiyao-Wangdaohengta-Hequ line, while the rest of the study area has a semi-arid climate (aridity index from 0.2 to 0.5).The results show that the study area is dominated by a semi-arid climate.
Table 1 Area of each category of aridity index and the (sand+silt)/clay ratio
Aridity index
(dimensionless)
Area
(km2)
Proportion (%) The (sand+silt)/clay ratio (dimensionless) Area
(km2)
Proportion
(%)
< 0.2 38,545 20.57 < 3 4616 2.46
0.2-0.5 148,877 79.43 3-5.67 129,925 69.32
> 0.5 0 0 > 5.67 52,881 28.21
Total 187,422 100 Total 187,422 100
2) Soil texture
In Figure 2A and Table 1, we also see that the areas where the (sand+silt)/clay ratio is less than 3, 3-5.67, and more than 5.67 are 4,616 km2 (2.46% of the study area), 129,925 km2 (69.32% of the study area), and 52,881 km2 (28.21% of the study area), respectively. Clay ((sand+silt)/clay ratio less than 3) is sporadically distributed in the Liupan Mountains and Qinling Mountains, sand and loam ((sand+silt)/clay ratio ranging from 3 to 5.67) are primarily distributed west of the Qingyangcha-Shenjiawan-Gaojiabao-Gaoshiya line, while the rest of the study area is covered by clay loam. The results show that most of the study area is covered by clay loam soil.
Table 2 Area of each category of slope gradient
Slope (degree) Area (km2) Proportion (%)
< 2 26,169 13.96
2-6 33,221 17.73
6-15 68,726 36.67
15-25 45,247 24.14
> 25 14,059 7.50
Total 187,422 100
3) Slope gradient
The slope gradient of the study area is shown in Figure 2B and Table 2.The areas with a slope gradient less than 2°, 2°-6°, 6°-15°, 15°-25°, and more than 25° are 26,169 km2 (13.96% of the study area), 33,221 km2 (17.73% of the study area), 68,726 km2 (36.67% of the study area), 45,247 km2 (24.14% of the study area), and 14,059 km2 (7.5% of the study area), respectively. Flat land of less than 6° accounts for just 31.69% of the study area, is distributed west of the Qingyangcha-Shenjiawan-Gaojiabao-Wangdaohengta line, and reaches from Jiaqiao to Jingcun along the Jinghe River. The results show that the study area is dominated by a steep slope gradient.
4.1.2 General characteristics of land use change
By overlaying the 1998 and 2010 land use maps, a land use change map for the period 1998-2010 (Figure 2C), and the areas of each category of land use in 1998 and 2010 were obtained (Table 3). Table 3 shows that grassland areas totaled 82,623 km2 (44.08% of the study area) in 1998 and 83,355 km2 (44.47% of the study area) in 2010; that farmland in the same years totaled 66,769 km2 (35.62% of the study area) and 58,538 km2 (31.23% of the study area), respectively; and that, in the period 1998-2010, high-coverage grassland, other woodland, and forest, increased significantly, while low-coverage grassland and farmland decreased in 2010 compared with 1998. The results show that the pattern of land use has changed, but land cover remains dominated by grassland and farmland. It should be noted that changes in water bodies were not analyzed, because the total area of water was small and appeared to be affected by precipitation.
Table 3 Area of each category of land use in 1998 and 2010
Land use type 1998 2010 1998-2010
km2 % km2 % km2 %
Farmland 66,769 35.62 58,538 31.23 -8231 -12.33
Forest 4984 2.66 7893 4.21 2909 58.37
Shrub 13,555 7.23 14,027 7.48 472 3.47
Open woodland 6,125 3.27 7349 3.92 1,224 19.98
Other woodland 1612 0.86 4,973 2.65 3,361 208.51
High-coverage grassland 6856 3.66 19,083 10.18 12,227 178.36
Medium-coverage grassland 44,752 23.88 45,791 24.43 1039 2.32
Low-coverage grassland 31,015 16.55 18,481 9.86 -12,534 -40.41
Water body 1487 0.79 1487 0.79 0 0
Construction land 2445 1.30 2692 1.44 247 10.09
Unused land 7822 4.17 7108 3.79 -714 -9.14
Total 187,422 - 187,422 - - -
As illustrated in Figures 1 and 2C, land use change occurred primarily west of the Yellow River, between 35 and 38 degrees north latitude, including the upper reach of the Jinghe River basin, the upper and middle reaches of the Beiluo River basin, the Yanhe River basin, the Qingjian River basin, and the upper and middle reaches of the Wuding River basin. In addition to these regions, land use east of the Yellow River, from north to south along the Yellow River, also changed significantly.
As shown in Table 4, the area of land use change was 42,302 km2, accounting for 22.57% of the study area. Among 84 transformation types, the area of four types, including (a) low-coverage grassland to medium-coverage grassland, (b) medium-coverage grassland to high-coverage grassland, (c) farmland to other woodland, and (d) farmland to medium-coverage grassland, represented more than 60% of the area experiencing land use change. Results indicate that land use change in the period 1998-2010 was dramatic and dominated by these four types.

4.2 Spatial variability of land use change affected by climate

Table 4 Primary land use change transformation types in the period 1998-2010
Transformation type Area Proportion (%) Note
Low to Med 11,225 5.99 Low=Low-coverage grassland
Med=Medium-coverage grassland
Hig=High-coverage grassland
Far=Farmland
Oth= Other woodland
Shr= Shrub
For= Forest
Ope= Open woodland
Med to Hig 9,886 5.27
Far to Oth 2,155 1.15
Far to Med 2,126 1.13
Low to Hig 1,488 0.79
Shr to For 1,355 0.72
Far to Low 1,296 0.69
Far to Hig 1,267 0.68
Far to Ope 921 0.49
Med to Shr 911 0.49
Other 77 types 9,672 5.16
All of the changed 42,302 22.57
Non-change 145,120 77.43
Total 187,422 - -
As one of the indicators of climate, dryness/wetness was an important factor affecting the spatial distribution of soil moisture and thereby affecting agricultural activities, and was a key factor in limiting the transformation direction of land use change (Brown et al., 2011). After calculating the means of the land use change intensity index (D), the vegetation change index (I), and the aridity index (K) of each sample basin, the relationships between land use change and climate could be revealed based on the subsection mean method described in section 3.7.
As illustrated in Figure 3, according to the subsection mean method, the average aridity index ranging from 0.16 to 0.35 is divided into three subsections, including 0.16-0.22, 0.22-0.29,and 0.29-0.35. The means of the land use change intensity index (D) in the three subsections are then 18.49%, 56.54%, and 42.62%, respectively (Figure 3A). In addition, the means of the vegetation change index (I) in these subsections are 5.79%, 26.27%, and 12.9% (Figure 3B). Taken together, these results indicate that generally, land use change in the semi-arid region is more dramatic than in the arid region, and the vegetation restoration effect is also more pronounced in the semi-arid than in the arid region.
With regard to climate, long-term drought conditions play a key role in the direction of land use change and limit the vegetation restoration effect in large-scale arid and semi-arid regions. Most arid regions in the study area are distributed in the upper reaches of the rivers. These regions have low water-resource availability and high irrigation costs resulting in a lower survival rate for artificial vegetation than occurs in semi-arid regions, and native vegetation that is dominated by low-coverage grassland. As a result, land use change and vegetation restoration levels are lower in arid than in semi-arid regions.
More specifically, as shown in Figure 3A and 3B, the land use change index and vegetation change index in the aridity index subsection 0.29-0.35 are both less than in the subsection 0.22-0.29, indicating that land use change in the regions in which the aridity index ranges from 0.22-0.29 is more dramatic than in the 0.29-0.35 range, and the vegetation restoration effect in the regions in which the aridity index ranges from 0.22-0.29 is more evident than in the 0.29-0.35 range. There appear to be two reasons for this phenomenon. First, because the regions in which the aridity index ranges from 0.29-0.35 are mostly distributed in the lower reaches of the rivers (Figure 2A), there is better water resource availability, and less farmland is being converted to woodland and grassland, so the land use change index is lower than in regions in which the aridity index ranges from 0.22-0.29. Second, land use change in these regions is dominated by two transformation types, medium-coverage grassland to high-coverage grassland and shrub to forest (Figure 2C), and according to Equation 2, the total vegetation area was not greater than the sum of forest, shrub, high-coverage grassland, and medium-coverage grassland. The vegetation change index is thus lower relative to regions in which the aridity index ranges from 0.22-0.29.
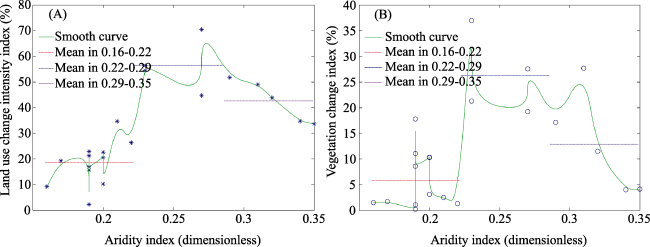
Figure 3 Relationships between land use change and dryness/wetness conditions (A) land use change intensity index and aridity index; (B) vegetation change index and aridity index

4.3 Spatial variability of land use change affected by soil properties

Soil affects moisture retention and thereby influences land use. Differences in soil properties affect water content (O'Geen, 2012), and so also affect the intensity of land use change and vegetation restoration. After calculating the means of the land use change intensity index (D),the vegetation change index (I), and the (sand+silt)/clay ratio for each sample basin, the relationships between land use change and soil properties were revealed.
Figure 4 illustrates these relationships. Based on the subsection mean method, the average (sand+silt)/clay ratio that ranges from 4.1 to 16.7 is divided into 4.1-8.3, 8.3-12.5, and 12.5-16.7 subsections. Accordingly, the mean land use change intensity index (D) for the three subsections are 36.21%, 22.58%, and 14.8%, respectively (Figure 4A). The mean vegetation change index (I) for the subsections are 13.26%, 10.34%, and 4.14% (Figure 4B). The smaller the (sand+silt)/clay ratio, the greater the values of D and I. The results indicate that the more the clay content of soil, the more changes in land use occurred and the more vegetation was restored.
Soil properties had a clear effect on land use change. Water storage and redistribution are a function of soil pore space and pore-size distribution, which can be governed by texture (Childs 1940). Clay-rich soils have the largest pore space, hence the greatest total water-holding capacity (O'Geen, 2012). Because vegetation is more likely to survive in clay-rich soils, land use changed more dramatically and vegetation was more clearly restored in regions with a high clay ratio.
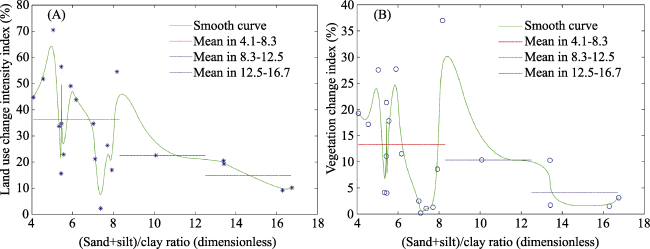
Figure 4 Relationships between land use change and soil texture (A) land use change intensity index and the (sand+silt)/clay ratio; (B) vegetation change index and the (sand+silt)/clay ratio

4.4 Spatial variability of land use change affected by topography

As an important indicator of topography, slope gradient has a clear effect on the intensity of soil erosion (Quan et al., 2001), and thereby affects soil fertility and patterns of land use. After calculating the means of the land use change intensity index (D), the vegetation change index (I), and the slope gradient of each sample basin, the relationships between land use change and topography could be obtained.
Figure 5 illustrates the relationship between land use change and topography. Based on the subsection mean method, the average slope gradient ranging from 2.1 to 16.6 is divided into 2.1-6.9, 6.9-11.8 and 11.8-16.6 subsections. Accordingly, the mean land use change intensity index (D) for the three subsections is 14.8%, 15.75%, and 43.6%, respectively (Figure 5A). In addition, the mean vegetation change index (I) for the subsections is 4.14%, 6.25%, and 15.93% (Figure 5B). The results indicate that the greater the slope gradient, the more dramatic the change in land use and the more vegetation was restored.
Land use changed with topography. Steeper slopes generally have rapid runoff, less moisture entering the soil (Balba, 1995), and lower grain productivity. Farmers in the study area prefer to grow crops on tablelands and in low-lying areas with a smaller slope gradient in order to improve grain self-sufficiency, which helps to explain why land with a smaller slope gradient is more difficult to transform into woodland and grassland. Land use changed more dramatically and vegetation was thus more restored at steeper slopes.
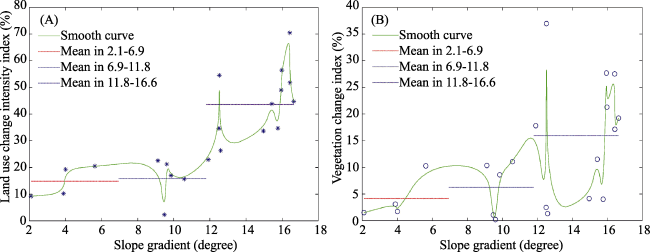
Figure 5 Relationships between land use change and topography (A) land use change intensity index and slope gradient; (B) vegetation change index and slope gradient

4.5 Relationship between land use change intensity and vegetation restoration effect

GTGP, launched in 1999, was primarily aimed at changing land use in order to achieve vegetation restoration. To further evaluate the consistency between these two aims, the relationship between land use change intensity and vegetation restoration are discussed using a linear regression method. As shown in Figure 6, the vegetation change index increases with the land use change intensity index; the correlation coefficient (R2) of both is 0.58. The results indicate that the increase in vegetation coincided with the growth in land use change, achieving the purpose of GTGP.
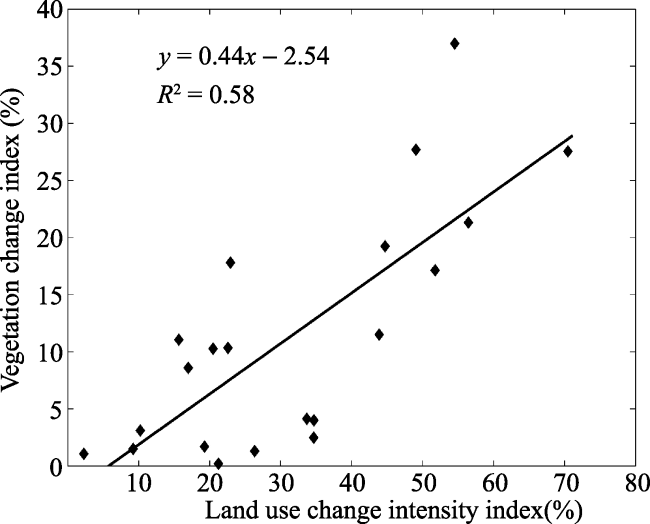
Figure 6 Relationship between land use change intensity and vegetation restoration effect

5 Conclusions

We constructed two indicators to evaluate the spatial variation of land use change as it is affected by environmental factors in the high-sediment region of the Loess Plateau. The results indicate that land use changed dramatically in the period 1998-2010.
We found first that the study area is dominated by a semi-arid climate, clay loam soil, and steep slope gradient. The area affected by land use change was 42,302 km2, accounting for 22.57% of the study area. High-coverage grassland, other woodland, and forest increased significantly, while low-coverage grassland and farmland were lower in 2010 compared with 1998. The pattern of land use has changed, but land cover still was dominated by grassland and farmland.
Second, we found that land use change occurred primarily west of the Yellow River, between 35 and 38 degrees north latitude, including the upper reaches of the Jinghe River basin, the upper and middle reaches of the Beiluo River basin, the Yanhe River basin, the Qingjian River basin, and the upper and middle reaches of the Wuding River basin. In addition to these regions, land use east of the Yellow River, from north to south along the Yellow River, also changed significantly. Four transformation types, (a) low-coverage grassland to medium-coverage grassland, (b) medium-coverage grassland to high-coverage grassland, (c) farmland to other woodland, and (d) farmland to medium-coverage grassland, were the primary types of land use change, representing together 60% of the total area experiencing land use change.
Third, significant spatial variation in land use change affected by the dryness/wetness, soil texture and slope gradient was found. In general, land use changed dramatically in semi-arid regions, remained relatively stable in arid regions, changed significantly in clay-rich soil, remained relatively stable in clay-poor soil, changed dramatically in steeper slopes, and remained relatively stable in tablelands and low-lying regions. Moreover, the increase in vegetation coincided with the increase in land use change for all of the environmental factors studied.
Overall, the findings help to evaluate the effect of the Grain to Green Program and are applicable to future designs for soil and water conservation in China’s Loess Plateau.

The authors have declared that no competing interests exist.

1
Balba A M, 1995. Management of Problem Soils in Arid Ecosystems. CRC Press. Boca Raton, Florida, 250 p.

2
Bouyoucos G J, 1935. The clay ratio as a criterion of susceptibility of soils to erosion.Journal of the American Society of Agronomy, 27: 738-741.

3
Brown Iain, Poggio Laura, Gimona Alessandroet al., 2011. Climate change, drought risk and land capability for agriculture: Implications for land use in Scotland.Regional Environmental Change, 11(3): 503-518.

4
Chen L D, Wang J, Fu B Jet al., 2001. Land-use change in a small catchment of northern Loess Plateau, China. Agriculture, Ecosystems and Environment, 86: 163-172.

5
Childs E C, 1940. The use of soil moisture characteristics in soil studies.Soil Science, 50: 239-252.

6
Fu B J, Liu Y, Lü Y Het al., 2011. Assessing the soil erosion control service of ecosystems change in the Loess Plateau of China.Ecological Complexity, 8: 284-298.

7
Fu B J, Qiu J Z, Chen L Det al., 2006. Temporal change in land use and its relationship to slope degree and soil type in a small catchment on the Loess Plateau of China.Catena, 65: 41-48.

8
Li G, Liang W, Yang Q K, 2009. Analysis of land use pattern change in coarse sandy region of middle reaches of Yellow River.Science of Soil and Water Conservation, 7(3): 52-58. (in Chinese)

9
Li L J, Jiang D J, Li J Yet al., 2007. Advances in hydrological response to land use/land cover change.Journal of Natural Resources, 22(2): 211-224. (in Chinese)

10
Lü Y H, Fu B J, Feng X Met al., 2012. A policy-driven large scale ecological restoration: quantifying ecosystem services changes in the Loess Plateau of China.Plos One, 7: 1-10.

11
Mao F, Sun H, Yang H L, 2011. Research progress in dry/wet climate zoning.Progress in Geography, 30(1): 17-26. (in Chinese)

12
O'Geen A T, 2012. Soil Water Dynamics.Nature Education Knowledge, 3(6): 12.

13
Opršal Z, Šarapatka B, Kladivo P, 2013. Land-use changes and their relationships to selected landscape parameters in three cadastral areas in Moravia (Czech Republic).Moravian Geographical Reports, 21(1): 41-50.

14
Pei X F, Gan Z M, Liu X, 2003. A study on the problem of returning farmland to forests in Yellow River Basin.Journal of Arid Land Resources and Environment, 17(3): 98-102. (in Chinese)

15
Quan B, M J M Römkens, Li Ret al., 2011. Effect of land use and land cover change on soil erosion and the spatio-temporal variation in Liupan Mountain Region, southern Ningxia, China.Frontiers of Environmental Science & Engineering in China, 5(4): 564-572.

16
Xin Z B, Ran L S, Lu X X, 2012. Soil Erosion Control and Sediment Load Reduction in the Loess Plateau: Policy Perspectives.International Journal of Water Resources Development, 28(2): 325-341.

17
Yang J P, Ding Y J, Chen R Set al., 2002. The interdecadal fluctuation of dry and wet climate boundaries in China in recent 50 years.Acta Geographica Sinica, 57(6): 655-661. (in Chinese)

18
Yang S T, Zhu Q J, 2000. Affect of man-computer interactive interpretation method in soil erosion survey of large scale by remote sensing.Journal of Soil and Water Conservation, 14(3): 88-91. (in Chinese)

19
Zhang L H, Xie Z K, Zhao R Fet al., 2012. The impact of land use change on soil organic carbon and labile organic carbon stocks in the Longzhong region of Loess Plateau.Journal of Arid Land, 4(3): 241-250.

20
Zhang X P, Zhang L, Wang Y et al. Tempo-spatially responses of the annual streamflow to LUCC in the middle reaches of Yellow River, China.Science of Soil and Water Conservation, 7(1): 19-26. (in Chinese)

Outlines

/