Research Articles

Radiative forcing over China due to albedo change caused by land cover change during 1990-2010

  • ZHAI Jun , 1, 2 ,
  • ZHAI Jun 1, 2 ,
  • LIU Ronggao , 2, * ,
  • ZHAO Guosong 2 ,
  • HUANG Lin 2
Expand
  • 1. Environmental Satellite Center, Ministry of Environmental Protection, Beijing 100094, China
  • 2. Institute of Geographic Sciences and Natural Resources Research, CAS, Beijing 100101, China

*Corresponding author: Liu Ronggao, Professor, E-mail:

Author: Zhai Jun (1985-), PhD, specialized in the study of quantitative remote sensing and climate change. E-mail:

Received date: 2014-03-03

  Accepted date: 2014-03-30

  Online published: 2014-05-20

Supported by

National Key Program for Developing Basic Science, No.2010CB950902.Strategic Priority Research Program of the Chinese Academy of Sciences, No.XDA05090303

Copyright

Journal of Geographical Sciences, All Rights Reserved

Abstract

Land cover change affects surface radiation budget and energy balance by changing surface albedo and further impacts the regional and global climate. In this article, high spatial and temporal resolution satellite products were used to analyze the driving mechanism for surface albedo change caused by land cover change during 1990-2010. In addition, the annual-scale radiative forcing caused by surface albedo changes in China’s 50 ecological regions were calculated to reveal the biophysical mechanisms of land cover change affecting climate change at regional scale. Our results showed that the national land cover changes were mainly caused by land reclamation, grassland desertification and urbanization in past 20 years, which were almost induced by anthropogenic activities. Grassland and forest area decreased by 0.60% and 0.11%, respectively. The area of urban and farmland increased by 0.60% and 0.19%, respectively. The mean radiative forcing caused by land cover changes during 1990-2010 was 0.062 W/m2 in China, indicating a warming climate effect. However, spatial heterogeneity of radiative forcing was huge among different ecological regions. Farmland conversing to urban construction land, the main type of land cover change for the urban and suburban agricultural ecological region in Beijing-Tianjin-Tangshan region, caused an albedo reduction by 0.00456 and a maximum positive radiative forcing of 0.863 W/m2, which was presented as warming climate effects. Grassland and forest conversing to farmland, the main type of land cover change for the temperate humid agricultural and wetland ecological region in Sanjiang Plain, caused an albedo increase by 0.00152 and a maximum negative radiative forcing of 0.184 W/m2, implying cooling climate effects.

Cite this article

ZHAI Jun , ZHAI Jun , LIU Ronggao , ZHAO Guosong , HUANG Lin . Radiative forcing over China due to albedo change caused by land cover change during 1990-2010[J]. Journal of Geographical Sciences, 2014 , 24(5) : 789 -801 . DOI: 10.1007/s11442-014-1120-4

1 Introduction

Land cover change, which could affect surface climate and environment by changing the surface biogeochemical and biophysical processes, is crucial on global climate change (Claussen et al., 2001; Pielke Sr, 2005). Recently, climate effects due to land cover change caused surface biogeochemical cycles have received widespread concern and in-depth research (Betts, 2001; Betts et al., 2007; Brovkin et al., 2006). For example, studies have shown that afforestation could mitigate the effect of climate warming by absorbing CO2. In contrast, deforestation would exacerbate climate warming because CO2 was emitted into atmosphere (Brovkin et al., 2004; Schimel et al., 2000). However, land cover change would also bring direct biophysical variety, such as surface albedo, which could bring equivalent or more significant climate effects by altering the surface radiation budget and energy balance. This process had gradually been paid much attention (Bala et al., 2006; Lee et al., 2011; Rotenberg et al., 2010). More and more evidence suggested that surface albedo is one of the main ways of land cover change affecting climate system in the middle and high latitudes of the earth. The magnitude of radiative forcing caused by albedo may outweigh the greenhouse gas magnitude at local scale, and then affects regional and global climate (Betts, 2001).
Surface radiative forcing, which is used to describe the net radiation energy at the earth surface after climate factors changing during a certain time scale(e.g. inter-annual scale), is in unit of W/m2. Surface radiative forcing can be used to measure and compare the contribution to climate of different factors (e.g. greenhouse gas, aerosol, land cover change) at the bottom of atmosphere (Andrews et al., 2009). The positive value of surface radiative forcing means the factor would cause temperature rise. On the contrary, the temperature may decrease. According to the IPCC 4th Assessment Report (AR4), since the industrial revolution, human-caused land use activities such as reclamation and deforestation, have brought radiation forcing of -0.25 W/m2 via an increase surface albedo which tends to cool the global climate (Solomon et al., 2007). However, radiative forcing caused by land cover change are highly uncertain because we have inadequate understanding of the land cover change driving mechanism for surface albedo variety in regional or local scales (Myhre et al., 2003; Pitman et al., 2009). The variation of surface albedo is determined by land cover change types and extent, and can produce radiative forcing with varying degrees in different spatial scales. The global mean radiative forcing not only weakens the contribution of land cover change, but also covers up the radiative forcing characteristics from various types of land cover change in different regions. So it is not conducive to land use decisions because the driving mechanism cannot be revealed well (Mahmood et al., 2010; Pielke Sr et al., 2002). Significant regional climate change will also influence larger-scale climate characteristics because of the atmospheric teleconnections (Pielke Sr et al., 2002; Wu et al., 2007). Therefore, taking the spatial heterogeneity of land cover types into full consideration and analyzing the land cover change driving mechanism for surface albedo in regional/local scales, can estimate radiative forcing temporal and spatial patterns quantitatively. Furthermore, it can enhance our understanding of the climate effects mechanism of land cover change, and provide basis for regional and global land use policy decisions in the future (Davin et al., 2007; Myhre et al., 2005).
Surface albedo, defined as the ratio of surface reflected radiation and incident radiation, is a dimensionless quantity describing the surface radiation characteristics. Albedo variation and climate effects are described and analyzed primarily through observation and climate model simulations. In situ albedo measurement cannot effectively describe surface albedo variation and the climate characteristics in spatial-temporal continual regional/local scales, because of data scarce, limited spatial scales and other shortcomings (Davidson et al., 2004). Climate effects simulations driving by land cover change also have significant limitations due to the uncertainty of albedo estimation models (Liang, 2007). And models generally carry out scenario simulation by the pre-assumed coarse resolution land cover data, which does not reflect the true land cover change process (Brovkin et al., 2006), and also not be able to meet the regional/local scales research needs accurately (Loarie et al., 2011; Meng et al., 2014). Satellite remote sensing technology can obtain high-resolution spatial and temporal continual surface parameters information, and can also reflect the true history land cover change. At present, the satellite products have become the main data sources and techniques for surface characteristics inversion, geographic regularity analysis, and climate change research in regional and global scales (Asner et al., 2010; Zhao et al., 2010).
China has complex topography and climate characteristics, which has produced a variety of ecosystem types. Since the 1990s, with the development of society and economy, land use intensification and land cover change became more and more noticeable and have significant spatial distribution pattern, especially the urbanization in the eastern cities of China, land reclamation in northeast China and northern Xinjiang province, and returning farmland to forest engineering in the Loess Plateau (Cao et al., 2009; Liu et al., 2005a). Some studies based on site observations and climate models indicate that land cover types had significant effects on the air temperature (Li et al., 2006; Yang et al., 2009), but did not reveal the biophysical mechanisms of these effects. Different types of land cover change could produce different magnitude of radiative forcing; even the same land cover change type may cause diverse radiative forcing in different spatial regions (Barnes et al., 2008). Here, land cover and surface albedo data from remote sensing, and reanalysis radiation data were used to quantitatively calculate the radiative forcing caused by land cover change in 50 research units, ecological regions of China. The purpose of this study was to study the spatial-temporal patterns and influence processes of land cover change on surface albedo and radiative forcing, and then revealed the biophysical driving mechanisms of land cover change on climate in regional/local scales.

2 Data and methods

2.1 Study area and ecological regions

In order to fully consider the impact of natural geographical divisions and human activities, the terrestrial China was chosen as the study area which was divided into 50 ecological regions (Table 1) according to Database for ecosystems and ecosystem services zoning in China (http://www.ecosystem.csdb.cn/). Then the surface radiative forcing due to albedo change caused by land cover change from 1990 to 2010 for 50 ecological regions was estimated separately.
Table 1 Serial numbers and names of 50 ecological regions in China
No. Ecological regions No. Ecological regions
1 The deciduous coniferous forest ecological region in Northern Greater Khingan Range 26 The hilly evergreen broad-leaved forest ecological region in Nanling Mountains
2 The coniferous and broad-leaved mixed forest ecological region in Lesser Khingan Range 27 The evergreen broad-leaved forest ecological region in northern Taiwan
3 The temperate agricultural and wetland ecological region in Sanjiang Plain 28 The hilly evergreen broad-leaved forest ecological region in central Yunnan, Guangxi and Guangdong province, and southern Fujian province
4 The mixed coniferous and broad-leaved forest ecological region in Changbai-Qianshan mountains 29 The urban and suburban agricultural ecological region in Pearl River Delta
5 The agricultural ecological region in eastern part of Northeast China Plain 30 The tropical monsoon forest and rainforest ecological region in southern Taiwan
6 The meadow steppe ecological region in western part of Northeast China Plain 31 The tropical monsoon forest and rainforest ecological region in southern Yunnan, Guangxi and Guangdong province
7 The deciduous forest and forest steppe ecological region in central and southern parts of Greater Khingan Range 32 The tropical agricultural ecological region around Hainan Island
8 The hilly deciduous broad-leaved forest ecological region in eastern Liaoning and Shandong province 33 The mountain rainforest and monsoon forest ecological region in central Hainan province
9 The urban and suburban agricultural ecological region in Beijing-Tianjin-Tangshan region 34 The typical steppe ecological region in central and eastern Inner Mongolia Plateau
10 The deciduous forest ecological region in Yanshan-Taihang Mountain 35 The desert steppe ecological region in central Inner Mongolia Plateau and central Gansu province
11 The agricultural ecological region in Fenhe-Weihe River Basin 36 The steppe desert ecological region in central Inner Mongolia Plateau
12 The agricultural and steppe ecological region on Loess Plateau 37 The mountain desert ecological region in western Inner Mongolia Plateau and Beishan Mountain
13 The agricultural ecological region in North China Plain 38 The mountain forest and grassland ecological region in Altai Mountains and eastern Junggar
14 The hilly evergreen broad-leaved forest ecological region in Huaiyang region 39 The desert ecological region in Junggar Basin
15 The deciduous and evergreen broad-leaved forest ecological region in Qinling-Daba Mountains 40 The mountain forest and steppe ecological region in Tianshan Mountains
16 The urban and suburban agricultural ecological region in the Yangtze River Delta 41 The desert ecological region in Tarim Basin and eastern Xinjiang
17 The agricultural ecological region in middle and lower reaches of the Yangtze River Basin 42 The forest and alpine grassland ecological region in Qilian Mountain
18 The ecological region of Three Gorges Reservoir 43 The desert ecological region in Qaidam Basin
19 The agroforestry ecological region in Sichuan Basin 44 The alpine desert steppe ecological region in Pamir-Kunlun-Altun Mountains
20 The evergreen broad-leaved forest ecological region in Tianmu-Huaiyu Mountains 45 The alpine meadow steppe ecological region in River’s Source Region and southern Gansu province
21 The hilly evergreen broad-leaved forest ecological region in Zhejiang and Fujian province 46 The alpine desert steppe ecological region on northern Tibet Plateau
22 The hilly evergreen broad-leaved forest ecological region in Hunan and Jiangxi province 47 The temperate arid mountain desert ecological region in Ali Mountains
23 The evergreen broad-leaved forest ecological region in Wuling-Xuefeng Mountains 48 The cold temperate coniferous forest ecological region in eastern Tibet and western Sichuan province
24 The karst evergreen broad-leaved forest ecological region in Central Guizhou province 49 The mountain alpine meadow steppe ecological region in southern Tibet
25 The evergreen broad-leaved forest ecological region in southwestern Sichuan province, northern and central Yunnan province 50 The rainforest and monsoon forest ecological region in southeastern Tibet

2.2 Land cover data

Historical land cover transition datasets were produced by human-machine interaction interpretations from Landsat-TM/ETM+ images with the Arc/Info platform. One kilometer resolution raster proportion datasets of land use/land cover types were processed in 1990 and 2010 (Liu et al., 2005b; Liu et al., 2014). Considering the albedo values of typical land cover types (Gao et al., 2005; Jin et al., 2002), two secondary categories (swampland and permanent snow and ice) were singled out from the unused land and water body. Finally, 8 categories consists of cropland, forestland, grassland, water bodies, built-up land, bare land, swampland, permanent snow and ice were used for calculation and analysis. Figure 1 shows the spatial pattern of land cover for terrestrial China in 2010.
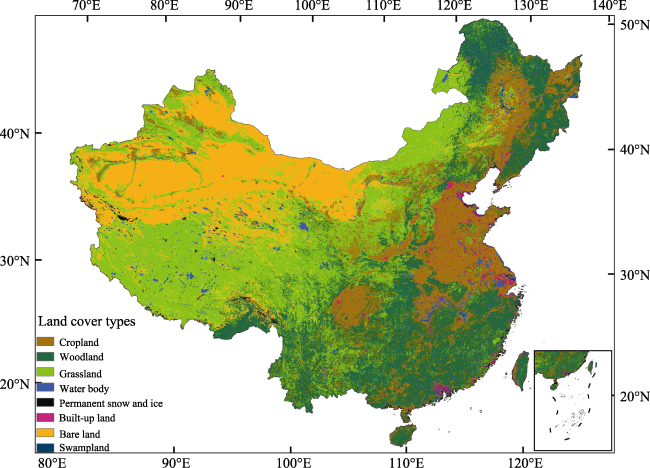
Figure 1 Land cover map of China in 2010

2.3 Surface albedo data and calculation method

Surface albedo data were provided by Moderate Resolution Imaging Spectroradiometer (MODIS) Collection 5 BRDF/Albedo 16-day 1000 m product, which were available every 8 days and contained MCD43B3 (v005) and MCD43B2 (v005) datasets (https://lpdaac. usgs.gov/). The MODIS surface albedo product had been evaluated globally and the accuracy of product could meet the needs of climate change spatial-temporal analysis (Liang et al., 2003; Sumner et al., 2011; Wang et al., 2004). The albedo quality assessment (QA) flags from MCD43B2 were used for quality control. Only “full BRDF inversion” pixels (QA=0 processed, good quality) were used from the “BRDF_Albedo_Quality” dataset (Schaaf et al., 2002). Also the “Snow_BRDF_Albedo” dataset were included to identify and exclude snow albedo retrievals. Following this quality control, the 8-day white sky shortwave (0.3-5.0 μm) snow-free albedo during 2009-2011 were averaged month by month, then mean monthly surface albedo for each ecological region was composed as follows:
where 
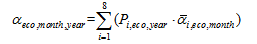
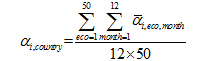
is the mean monthly albedo for each ecological region. For each land cover type is the land cover type area proportion. To ensure that each albedo pixel represented a single land cove type and enhance the robustness of the results, for the land cover data in 2010, only the pixels whose area proportion greater than 90% were extracted as the pure raster. Then the land cover pure raster of each ecological region could be obtained. is the mean monthly white sky shortwave snow-free albedo in each ecological region for land cover type i.
The surface albedo change over China from 1990 to 2010 could be estimated as:
The snow-free albedo of 8 land cover types is estimated as:
where 
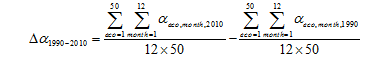
is the surface albedo of land cover type .

2.4 Surface solar radiation downward (SSRD) data

Surface solar radiation downward (SSRD) were provided by the European Center for Medium-Range Weather Forecasts (ECMWF) ERA-Interim reanalysis dataset, which had been interpolated on to a regular 0.75°×0.75° and were quality controlled carefully (Dee et al., 2011). Data from January 1990 to December 2010 were used to derive mean monthly SSRD for each ecological region. The equation is given below:
where 
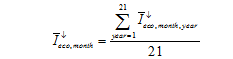
is mean monthly SSRD in each ecological region from 1990 to 2010.
Then mean SSRD in each ecological region could be averaged from 12 monthly values as:

2.5 Radiative forcing calculation

Monthly radiative forcing in each ecological region from 1990 to 2010 is calculated as:
where 
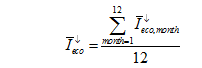
is the mean monthly SSRD derived from 1990 to 2010 in each ecological region.
The mean annual radiative forcing for each ecological region could be averaged by the 12 monthly values. The equation is shown below:

3 Results

3.1 Land cover changes in ecological regions from 1990 to 2010

From 1990 to 2010, the dominant land cover changes were the increased built-up land (0.60%) and cropland area (0.19%), and the decreased grassland (-0.60%) and woodland area (-0.11%) (Table 2). The main area changes of land covers in each ecological region were showed in Figure 2, which indicated that land cover change had obvious spatialtemporal variation. The increased cropland mainly occurred in the Sanjiang Plain, Northeast China Plain, and mountain forest and grassland areas in northern Xinjiang. Therefore, the decreased forest and grassland were mainly found in Northeast China and northern Xinjiang due to land reclamation. In the arid and semi-arid region of Inner Mongolia, forest and grassland decreased significantly owing to desertification. Increased built-up land was mainly distributed in rapidly urbanized region, such as Pearl River Delta region, Beijing-Tianjin-Tangshan region, and middle and lower reaches of the Yangtze River Basin and Sichuan Basin. It was mainly from occupation of cropland.
Table 2 Area and net area change of 8 land cover types during 1990-2010 (104 km2)
Land cover type Area (1990) Area
(2010)
Area change (1990-2010)
Cropland 140.58 142.40 1.82
Woodland 227.91 227.05 -0.85
Grassland 288.55 283.23 -5.32
Water body 21.17 21.69 0.51
Built-up land 17.25 22.77 5.52
Bare land 200.96 200.69 -0.27
Permanent
snow and ice
4.69 4.67 -0.02
Swampland 12.76 11.87 -0.89

3.2 Surface albedo change in ecological regions from 1990 to 2010

The mean and standard deviation values of snow-free surface albedo for the 8 land cover types were calculated by equation (3) (Figure 3). The figure shows that it was necessary to single out the permanent snow, ice and swampland from their top categories because their albedo values were very different with the values of water body and bare land. The surface albedo values of 8 land cover types were consistent with previous results (Barnes et al., 2008; Myhre et al., 2005).
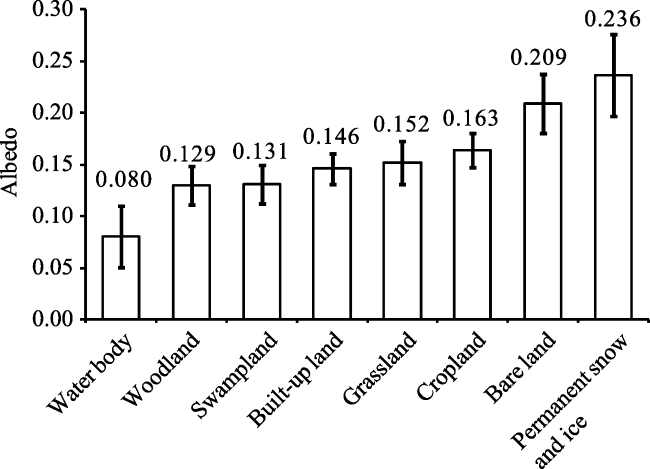
Figure 3 The mean value and STD of surface albedo for 8 land cover types in China
Net surface albedo change caused by land cover changes in 50 ecological regions was illustrated in Figure 4. The largest albedo decrease (-0.00456) occurred in the urban and suburban agricultural ecological region in Beijing-Tianjin-Tangshan, whereas the largest albedo increase (0.00152) was in the temperate agricultural and wetland ecological region in Sanjiang Plain. Surface albedo change (Figure 4) was not entirely consistent with the area change of land cover (Figure 2) in ecological regions, and the correlation coefficient was only 0.263. This was because the albedo variety was mainly related to land cover transform pattern. Overall, surface albedo decreased by 0.00042 on average between 1990 and 2010 for terrestrial China.
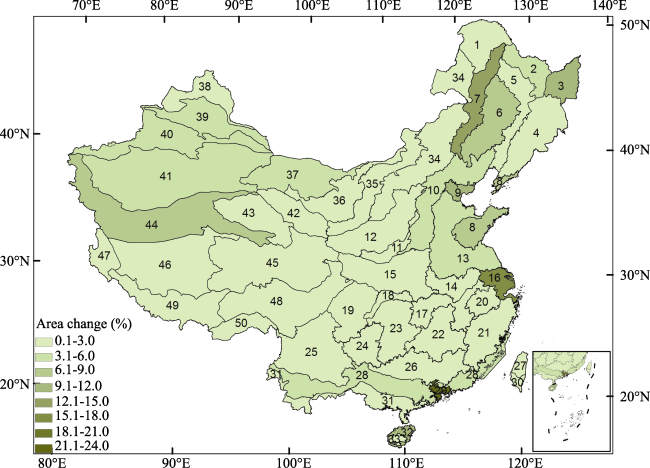
Figure 2 Main land cover area changes in 50 ecological regions of China during 1990-2010

3.3 Radiative forcing in ecological regions from 1990 to 2010

Figure 5 illustrates the radiative forcing of ecological regions from 1990 to 2010. The radiative forcing were ranged from -0.184 W/m2 in temperate agricultural and wetland ecological region in Sanjiang Plain to 0.863 W/m2 in urban and suburban agricultural ecological region in Beijing-Tianjin-Tangshan region. In the 50 ecological regions, the variation of radiative forcing was consistent with surface albedo change, and the correlation coefficient was 0.987. High radiative forcing regions were distributed in northeastern China, northern Xinjiang, Sichuan Basin, Beijing-Tianjin-Tangshan region, middle and lower reaches of the Yangtze River basin and Pearl River Delta. Although this geographic distribution of radiative forcing was similar with the land cover change distribution (Figure 2), weak correlation of 0.273 was observed among them. As a whole, 12 ecological regions showed negative forcing and 38 regions showed positive forcing values. The mean radiative forcing was 0.062 W/m2 for terrestrial China that indicated a warming effect.
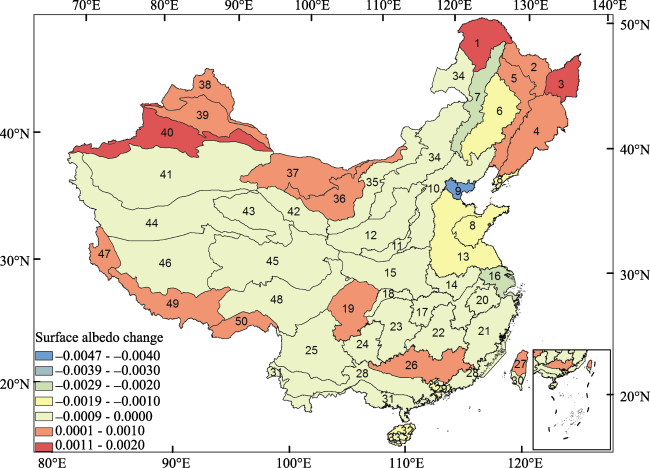
Figure 4 The surface albedo changes of ecological regions due to land cover changes in China during 1990-2010
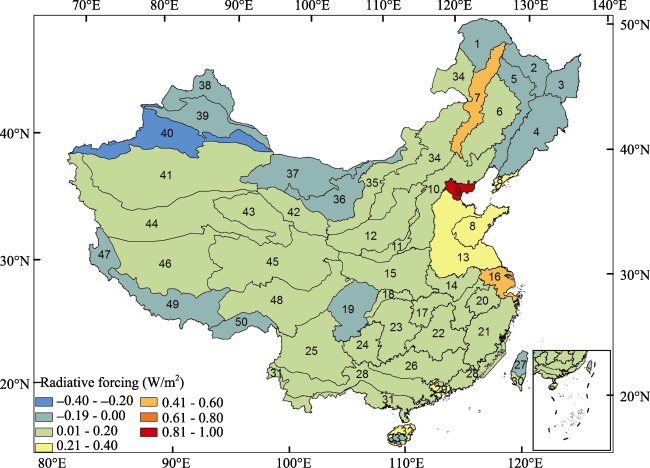
Figure 5 The radiative forcing due to land cover changes for each ecological region during 1990-2010
Table 3 summarizes the ecological regions with the highest positive and negative radiative forcings, SSRD and surface albedo change, and its main land cover change types (the maximum conversion area). The land cover change type with the highest positive radiative forcing was mainly transferred from cropland to built-up land. The highest negative radiative forcing occurred mainly in regions with transformations from woodland and grassland to other land cover types (e.g. cropland, bare land). It was worth noting that the ecological regions with the largest area of land cover change, like the deciduous forests and forests steppe ecological region in central and southern parts of Greater Khingan Range, did not have the highest radiative forcing values. The orders of land cover area changes and radiative forcings were not consistent (Figures 2 and 5). Therefore, local land cover change types were the main factors for spatial variations of radiative forcing.
Table 3 The highest 5 annual positive/negative radiative forcing ecological region’s downward surface shortwave radiation, surface albedo change and main land-cover change types during 1990-2010
Ecological region (No.) Radiative forcing (W/m2) Mean annul monthly SSRD (W/m2) Mean annul monthly albedo change Main land
cover change
The urban and suburban agricultural ecological region in Beijing-Tianjin-Tangshan region(9) 0.863 183.9 -0.00465 Cropland to
built-up land
The urban and suburban agricultural ecological region in the Yangtze River Delta (16) 0.459 181.9 -0.00249 Cropland to
built-up land
The deciduous forest and forest steppe ecological region in central and southern parts of Greater Khingan Range (7) 0.449 170.8 -0.00256 Woodland and
grassland to cropland
The hilly deciduous broad-leaved forest ecological region in eastern Liaoning and Shandong provinces (8) 0.245 188.1 -0.00129 Grassland to built-up land
The agricultural ecological region in North China Plain (13) 0.243 185.4 -0.00131 Cropland to
built-up land
The temperate agricultural and wetland ecological region in Sanjiang Plain (3) -0.184 148.2 0.00152 Woodland and grassland to cropland
The deciduous coniferous forest ecological region in
Northern Greater Khingan Range (1)
-0.172 143.3 0.00121 Woodland to grassland
The coniferous and broad-leaved mixed forest ecological region in Lesser Khingan Range (2) -0.102 143.7 0.00093 Woodland and
grassland to cropland
The mixed coniferous and broad-leaved forest ecological region in Changbai-Qianshan mountains (4) -0.025 156.5 0.00021 Woodland to
cropland
The steppe desert ecological region in central Inner Mongolia Plateau (36) -0.023 210.8 0.00008 Grassland to bare
land

4 Discussion

4.1 Effects of spatial scale on the radiative forcing estimation

Between 1990 and 2010, main land use activities were land reclamation and intense urbanization across China (Liu et al., 2005a, 2005b). The vast majority of increased built-up land was transferred from cropland (Liu et al., 2005b). During the past 20 years, land use activities accounted for almost all of the land cover changes owing to the rapid social and economic development in China. The reason for surface albedo variation is the difference in land cover types (Pitman et al., 2009). Spatial heterogeneity of radiative forcing due to albedo changes can be shown at ecological region scale, but is masked at national average scale (Barnes et al., 2008). Our results indicated that analysis in ecological regions could better reflect the radiative forcing characteristics than national large scale analysis, and the land cover driving mechanism could be revealed expediently. However, there are some other complex land cover transitions in an ecological region, such as fire, flood, hurricane and other local scale changes which may play dominant roles in surface energy budget and climate characteristics (Liu et al., 2008; Loarie et al., 2011; O’Halloran et al., 2012). As a result, the higher resolution land cover changes are needed to capture the climate effects in forthcoming study.

4.2 Snow effect on radiative forcing estimation

Generally, snow has significantly higher albedo value than other land cover types (Figure 3). Snow not only affects the seasonal radiative forcing variation, but also can amplify the radiative forcing due to land cover changes (Jin et al., 2002). Especially in the mid and high latitude regions, woodland has significant lower albedo value than cropland and grassland because of the difference in canopy structure, thus deforestation typically increases albedo and reduces the absorbed radiation of surface. However, when it snows in winter, tree branches and shadowing may hide the surface snow, but crop and grass may be entirely covered by snow. This phenomenon can increase the difference of albedo and produce a cooling effect (Flanner et al., 2011; Lee et al., 2011; Ni-Meister et al., 2011). This article only considered the snow-free conditions, which may underestimate the radiative forcings due to land cover changes in northern China.

4.3 Effect of other surface parameters on radiative forcing estimation

Studies of land cover change influencing surface biophysical parameters, especially radiative forcing, are integral parts for comprehensive understanding of human induced climate effects and the basis of surface energy budget. In addition to the surface albedo, land cover changes can significantly alter other surface biophysical parameters which could also influence surface energy balance, such as emissivity, roughness, etc. (Thom et al., 2006; van den Broeke et al., 2008; Zhai et al., 2013). These parameters could influence the surface longwave radiation budget, which operate in day and night. Consequently, a deep understanding of land cover changes affecting surface energy budget and balance needs comprehensive research for the radiation characteristics and spatial-temporal patterns of more biophysical parameters.

5 Conclusions

(1) Based on high spatial-temporal resolution satellite products, China’s radiative forcing and surface albedo variation mechanisms due to land cover change were estimated. Our results showed that the main land cover conversion due to reclamation, grassland desertification, and urbanization were almost caused by human land use activities. The grassland and forest decreased by 0.60% and 0.11%, while built-up land and cropland increased by 0.60% and 0.19% respectively for whole China.
(2) As documented in this essay, we concluded that land cover types had obvious differences in surface albedo. The sign and magnitude of albedo showed strong spatial heterogeneity. For example, the urban and suburban agricultural ecological region in Beijing-Tianjin-Tangshan region had the largest albedo decrease of 0.00456, while the temperate zone agricultural and wetland ecological region in Sanjiang Plain showed the obvious albedo increase of 0.00152.
(3) Considering the SSRD dataset, our calculation results showed that the national mean radiative forcing was 0.062 W/m2 during 1990-2010 in China, which meant warming effect. In ecological region scale, the absolute value of radiative forcing could reach to 0.863 W/m2, which was more than twice the value (0.25 W/m2) from IPCC since the industrial revolution in global average. Radiative forcings due to land cover changes had obvious spatial-temporal patterns but were not significantly correlated with the land cover area changes. Therefore, analysis in regional/local scales could help to reveal that the land cover transforms were the main reason of albedo-induced radiative forcing distribution.

The authors have declared that no competing interests exist.

1
Andrews T, Forster P M, Gregory J M, 2009. A surface energy perspective on climate change.Journal of Climate, 22(10): 2557-2570.

2
Asner G P, Alencar A, 2010. Drought impacts on the Amazon forest: The remote sensing perspective.The New Phytologist, 187(3): 569-578.

3
Bala G, Caldeira K, Mirin Aet al., 2006. Biogeophysical effects of CO2 fertilization on global climate.Tellus Series B-Chemical and Physical Meteorology, 58(5): 620-627.

4
Barnes C A, Roy D P, 2008. Radiative forcing over the conterminous United States due to contemporary land cover land use albedo change.Geophysical Research Letters, 35(9): L09706.

5
Betts R A, 2001. Biogeophysical impacts of land use on present-day climate: Near-surface temperature change and radiative forcing.Atmospheric Science Letters, 2(1-4): 39-51.

6
Betts R A, Falloon P D, Goldewijk K Ket al., 2007. Biogeophysical effects of land use on climate: Model simulations of radiative forcing and large-scale temperature change.Agricultural and Forest Meteorology, 142(2-4): 216-233.

7
Brovkin V, Claussen M, Driesschaert Eet al., 2006. Biogeophysical effects of historical land cover changes simulated by six earth system models of intermediate complexity.Climate Dynamics, 26(6): 587-600.

8
Brovkin V, Sitch S, Von Bloh Wet al., 2004. Role of land cover changes for atmospheric CO2 increase and climate change during the last 150 years.Global Change Biology, 10(8): 1253-1266.

9
Cao S X, Chen L, Yu X X, 2009. Impact of China’s Grain for Green Project on the landscape of vulnerable arid and semi-arid agricultural regions: A case study in northern Shaanxi Province.Journal of Applied Ecology, 46(3): 536-543.

10
Claussen M, Brovkin V, Ganopolski A, 2001. Biogeophysical versus biogeochemical feedbacks of large-scale land cover change.Geophysical Research Letters, 28(6): 1011-1014.

11
Davidson A, Wang S S, 2004. The effects of sampling resolution on the surface albedos of dominant land cover types in the North American boreal region.Remote Sensing of Environment, 93(1/2): 211-224.

12
Davin E L, de Noblet-Ducoudre N, Friedlingstein P, 2007. Impact of land cover change on surface climate: Relevance of the radiative forcing concept.Geophysical Research Letters, 34(13): L13702.

13
Dee D, Uppala S, Simmons Aet al., 2011. The ERA-Interim reanalysis: Configuration and performance of the data assimilation system.Quarterly Journal of the Royal Meteorological Society, 137(656): 553-597.

14
Flanner M G, Shell K M, Barlage Met al., 2011. Radiative forcing and albedo feedback from the Northern Hemisphere cryosphere between 1979 and 2008.Nature Geoscience, 4(3): 151-155.

15
Gao F, Schaaf C B, Strahler A Het al., 2005. MODIS bidirectional reflectance distribution function and albedo Climate Modeling Grid products and the variability of albedo for major global vegetation types.Journal of Geophysical Research-Atmospheres, 110(D01104): D01104.

16
Jin Y, Schaaf C B, Gao Fet al., 2002. How does snow impact the albedo of vegetated land surfaces as analyzed with MODIS data?Geophysical Research Letters, 29(10): 1374.

17
Lee X, Goulden M L, Hollinger D Yet al., 2011. Observed increase in local cooling effect of deforestation at higher latitudes.Nature, 479(7373): 384-387.

18
Li Q P, Ding Y H, Dong W J, 2006. A numerical simulation of impact of historical land-use changes on regional climate in China since 1700.Acta Meteorologica Sinica, 64(3): 257-270. (in Chinese)

19
Liang S L, 2007. Recent developments in estimating land surface biogeophysical variables from optical remote sensing.Progress in Physical Geography, 31(5): 501-516.

20
Liang S L, Shuey C J, Russ A Let al., 2003. Narrowband to broadband conversions of land surface albedo: II. Validation.Remote Sensing of Environment, 84(1): 25-41.

21
Liu H P, Randerson J T, 2008. Interannual variability of surface energy exchange depends on stand age in a boreal forest fire chronosequence.Journal of Geophysical Research-Biogeosciences, 113(G1): G01006.

22
Liu J Y, Liu M L, Tian H Qet al., 2005a. Spatial and temporal patterns of China’s cropland during 1990-2000: An analysis based on Landsat TM data.Remote Sensing of Environment, 98(4): 442-456.

23
Liu J Y, Tian H Q, Liu M Let al., 2005b. China’s changing landscape during the 1990s: Large-scale land transformations estimated with satellite data.Geophysical Research Letters, 32(2): L02405.

24
Liu J Y, Kuang W H, Zhang Z Xet al., 2014. Spatiotemporal characteristics, patterns, and causes of land-use changes in China since the late 1980s. Journal of Geographical Sciences, 24(2): 195-210.

25
Loarie S R, Lobell D B, Asner G Pet al., 2011. Direct impacts on local climate of sugar-cane expansion in Brazil.Nature Climate Change, 1(2): 105-109.

26
Mahmood R, Quintanar A I, Conner Get al., 2010. Impacts of land use/land cover change on climate and future research priorities.Bulletin of the American Meteorological Society, 91(1): 37-46.

27
Meng X H, Evans J P, McCabe M F, 2014. The influence of inter-annually varying albedo on regional climate and drought.Climate Dynamics, 42(3/4): 787-803.

28
Myhre G, Kvalevag M M, Schaaf C B, 2005. Radiative forcing due to anthropogenic vegetation change based on MODIS surface albedo data.Geophysical Research Letters, 32(21): L21410.

29
Myhre G, Myhre A, 2003. Uncertainties in radiative forcing due to surface albedo changes caused by land-use changes.Journal of Climate, 16(10): 1511-1524.

30
Ni-Meister W, Gao H L, 2011. Assessing the impacts of vegetation heterogeneity on energy fluxes and snowmelt in boreal forests.Journal of Plant Ecology-UK, 4(1/2): 37-47.

31
O’Halloran T L, Law B E, Goulden M Let al., 2012. Radiative forcing of natural forest disturbances.Global Change Biology, 18(2): 555-565.

32
Pielke Sr R A, 2005. Land use and climate change.Science, 310(5754): 1625-1626.

33
Pielke Sr R A, Marland G, Betts R Aet al., 2002. The influence of land-use change and landscape dynamics on the climate system: Relevance to climate-change policy beyond the radiative effect of greenhouse gases. Philosophical Transactions of the Royal Society of London. Series A: Mathematical, Physical and Engineering Sciences, 360(1797): 1705-1719.

34
Pitman A, de Noblet-Ducoudré N, Cruz Fet al., 2009. Uncertainties in climate responses to past land cover change: First results from the LUCID intercomparison study.Geophysical Research Letters, 36(14): L14814.

35
Rotenberg E, Yakir D, 2010. Contribution of semi-arid forests to the climate system.Science, 327(5964): 451-454.

36
Schaaf C B, Gao F, Strahler A Het al., 2002. First operational BRDF, albedo nadir reflectance products from MODIS.Remote Sensing of Environment, 83(1/2): 135-148.

37
Schimel D, Melillo J, Tian Het al., 2000. Contribution of increasing CO2 and climate to carbon storage by ecosystems in the United States.Science, 287(5460): 2004-2006.

38
Solomon S, Qin D, Manning Met al., 2007. The Physical Science Basis. Contribution of Working Group I to the Fourth Assessment Report of the Intergovernmental Panel on Climate Change: 235-337.

39
Sumner D M, Wu Q L, Pathak C S, 2011. Variability of albedo and utility of the MODIS albedo product in forested wetlands.Wetlands, 31(2): 229-237.

40
Thom A, Stewart J, Oliver Het al., 2006. Comparison of aerodynamic and energy budget estimates of fluxes over a pine forest.Quarterly Journal of the Royal Meteorological Society, 101(427): 93-105.

41
van den Broeke M, Smeets P, Ettema Jet al., 2008. Surface radiation balance in the ablation zone of the west Greenland ice sheet.Journal of Geophysical Research, 113(D13): D13105.

42
Wang K C, Liu J M, Zhou X Jet al., 2004. Validation of the MODIS global land surface albedo product using ground measurements in a semidesert region on the Tibetan Plateau.Journal of Geophysical Research-Atmospheres, 109(D5): D05107.

43
Wu L, Liu Z, Li Cet al., 2007. Extratropical control of recent tropical Pacific decadal climate variability: A relay teleconnection.Climate Dynamics, 28(1): 99-112.

44
Yang X C, Zhang Y L, Liu L Set al., 2009. Sensitivity of surface air temperature change to land types in China.Science China Series D-Earth, 14(5): 638-646.

45
Zhai J, Liu J Y, Liu R Get al., 2013. Spatial-temporal patterns and important factors driving and surface emissivity in China, 2000-2011.Resources Science, 35(10): 2094-2103. (in Chinese)

46
Zhao M S, Running S W, 2010. Drought-induced reduction in global terrestrial net primary production from 2000 through 2009.Science, 329(5994): 940-943.

Outlines

/