Review Articles

A review of historical reconstruction methods of land use/land cover

  • YANG Yuanyuan , 1, 2, 3 ,
  • ZHANG Shuwen , 2, 1, * ,
  • YANG Jiuchun 2 ,
  • CHANG Liping 2 ,
  • BU Kun 2 ,
  • XING Xiaoshi 3
Expand
  • 1. College of Earth Science, Jilin University, Changchun 130061, China
  • 2. Northeast Institute of Geography and Agroecology, CAS, Changchun 130102, China
  • 3. Center for International Earth Science Information Network (CIESIN), Columbia University, Palisades, NY 10964, USA;

*Corresponding author: Zhang Shuwen (1955-), Researcher, specialized in land use and land cover change. E-mail:

Author: Yang Yuanyuan (1988-), PhD Candidate, specialized in land use and land cover change. E-mail:

Received date: 2013-05-28

  Accepted date: 2014-01-22

  Online published: 2014-04-20

Supported by

National Natural Science Foundation of China, No.41271416.CAS “Strategic Priority Research Program”, No.XDA05090310

Copyright

Journal of Geographical Sciences, All Rights Reserved

Abstract

Understanding long-term human-environment interactions requires historical reconstruction of past land-use and land-cover changes. Most reconstructions have been based primarily on consistently available and relatively standardized information from historical sources. Based on available data sources and a retrospective research, in this paper we review the approaches and methods of the digital reconstruction and analyze their advantages and possible constraints in the following aspects: (1) Historical documents contain qualitative or semi-quantitative information about past land use, which also usually include land-cover data, but preparation of archival documents is very time-consuming. (2) Historical maps and pictures offer visual and spatial quantitative land-cover information. (3) Natural archive has significant advantages as a method for reconstructing past vegetation and has its unique possibilities especially when historical records are missing or lacking, but it has great limits of rebuilding certain land-cover types. (4) Historical reconstruction models have been gradually developed from empirical models to mechanistic ones. The method does not only reconstruct the quantity of land use/cover in historical periods, but it also reproduces the spatial distribution. Yet there are still few historical land-cover datasets with high spatial resolution. (5) Reconstruction method based on multiple-source data and multidisciplinary research could build historical land-cover from multiple perspectives, complement the missing data, verify reconstruction results and thus improve reconstruction accuracy. However, there are challenges that make the method still in the exploratory stage. This method can be a long-term development goal for the historical land-cover reconstruction. Researchers should focus on rebuilding historical land-cover dataset with high spatial resolution by developing new models so that the study results could be effectively applied in simulations of climatic and ecological effects.

Cite this article

YANG Yuanyuan , ZHANG Shuwen , YANG Jiuchun , CHANG Liping , BU Kun , XING Xiaoshi . A review of historical reconstruction methods of land use/land cover[J]. Journal of Geographical Sciences, 2014 , 24(4) : 746 -766 . DOI: 10.1007/s11442-014-1117-z

1 Introduction

The anthropogenic impact on the landscape has increased enormously both in intensity and on scale over the past centuries, mainly through the expansion of agriculture, which has been the most significant historical change in land cover (de Sherbinin, 2002; Schneider, 2007). And in this context land-use planning is becoming more and more important. Most landscapes are cultural ones, shaped over time, in an interactive process linking human needs with natural resources in a specific topographic and spatial setting. Periods of significant land use and management can often be distinguished, as past human activities left certain imprint on the scenery and ecosystem while some remain visible over thousands of years. Thus, current pattern and processes of land covers are part of the legacy from the past, and analyzing historical land use/cover change is essential to understand current human-environment dynamics and to predict the development of future land-use change (Marcucci, 2000; Foster et al., 2003; DeFries et al., 2004).
Historical land-use legacies have a strong and sometimes over-riding influence on the dynamics of present-day ecosystems, exhibiting a time-lagged response. Decadal to centennial land-cover change has been consistently singled out as a key element and an important driver of global environmental change (Liu, 2002; Turner, 2007; Foster et al., 2003; Gragson and Bolstad, 2006). Current ecological issues such as soil degradation (Dupouey et al., 2002; Bakker et al., 2005), water quality (Bolstad, 1997; Wear et al., 1998; Jones et al., 2001), habitat loss and fragmentation (Sinclair et al., 1995; Pearson et al., 1999), and biodiversity loss (Harding et al., 1998; Sala et al., 2000; Huston, 2005) and, especially, the global carbon balance (Houghton, 2003), have been linked closely to historical land use. Understanding long-term human-environment interactions is essential to understand changes in terrestrial ecosystems and it requires digital reconstruction of historical land-cover changes (Goldewijk and Battjes, 1997; Ramankutty and Foley, 1999a; Petit and Lambin, 2002). Besides, to make an intelligent choice for the future and to utilize land resources sustainably, we need to have a better understanding and quantification of historical and spatial-temporal patterns of land cover in the format of databases. These historical databases can also be utilized for various ecological, educational and management applications (Cogbill et al., 2002; Bolliger et al., 2004; Marcucci, 2000).
Reliable data and information on historical land use and land cover change, however, are not easy to be reconstructed. The digital reconstruction of previous land-cover is very challenging, which needs close interdisciplinary cooperation (e.g., geology, geochronology, geodesy, remote sensing, hydrology, climatology, land surveying, palaeontology, archaeology, history and cartography) (Draganits, 2008). Land cover is visible in remotely-sensed data from satellite platforms, although it requires interpretation with ground-truthing and uncertainties would still remain. Recently, continuously observing global characterization of land cover has become feasible with the use of improved remote sensing technology. However, remotely sensed data exist only for the last four decades at most after the advent of the first land satellite, Landsat-1, launched in 1972. Prior to that, one has to rely on other data sources, which could cover the global scale but often inconsistently. Such a historical perspective is vital to obtain a good understanding of land cover change. Fortunately, in most of China, as well as in Europe and India, there have been more or less intensive cultural impacts on the land-cover for several thousand years, and various historical data sources have exited (e.g., extensive tax records, frequent cadastral and forest surveys, historical maps, aerial photographs, archaeological vestiges) (Goldewijk and Ramankutty, 2004; Liu, 1996).
There have been approaches in digital reconstruction of the historical land use and land cover. Generally, over the time slice, researchers use various data sources and different study methods based on their different subject backgrounds, study areas and research scales, both spatial and temporal. This paper provides a retrospective overview of historical reconstruction methods of past land-cover based on the prime data sources and research approaches. This research also attempts to provide a theoretical basis for the subsequent digital reconstruction of land use and land cover.

2 Reconstruction methods

2.1 Reconstruction based on historical documents

Many public and privately owned archives are replete with documents containing information about past land use and land management. Historical records provide land managers with information that could be used to understand trajectories of land use/cover change. From the domestic and foreign research, the related historical documents mainly include chronicles, timber ledgers, tax record, census data, land survey records (e.g., Public Land Survey (PLS) records), forest inventories, paleoecological records, government report,gazetteer, notes of surveyors, statistical inventories, genealogy, general description by travelers, paintings, farmers’ diaries, cultural histories, etc., such as Chinese agricultural profile estimates, Statistical compilation of Chinese forest resource, Literature of Qing Dynasty, Statistical Yearbook. Official documents often record national historical events. Researchers generally could collect some great happenings of that time concerning the overall situation, but indirectly understand the location, size of land reclamation from the genealogy. Besides, for example, a farmer’s diary may be as valuable as contemporary newspaper reports or official agricultural statistics in contribution towards the reconstruction of past land-use practices and human impacts on the land (Russell, 1997). By combining different source types, a more complete picture of historical land-cover can often be obtained (Bürgi, 2007). Based on the data characteristics from historical documents, there are mainly two reconstruction methods. Firstly, researchers could extract directly useful information about historical land cover from these old documents after qualitative or semi-quantitative analysis and then form the uniform tabular data. Before calculating the quantity of land cover in study period, they must admit that the records and other spatial data could reflect the overall trends and regional differences of land-cover area (Ge, 2003). Ge (2003) revised the “Cropland Taxes” recorded in historical documents of Qing Dynasty and then studied the change characteristics in arable quantity and the driving factors in 18 provinces of China in the last 300 years. He (2011) speculated cropland area and population of each Lu (administrative region of Northern Song Dynasty) during the mid-Northern Song Dynasty by analyzing some society factors according to “Cropland Taxes” and “the Number of Households” data recorded in historical documents. By that way he reconstructed the gridding spatial distribution pattern of cropland of that dynasty. Taking Zhenlai County of Jilin Province as the study area, Lv (2010) discussed the application of toponymy and other correlative historical data to acquire the beginning period of large-scale land reclamation and analyzed the characteristics of residential area evolvement and land development in the study area. Zhang (2011a; 2011b) collected 197 records from Chinese historical documents including gazettes, government archives, traveling notes, etc., to reveal the primary natural vegetation pattern prior to significant agriculture (i.e., the late 17th century). Fensham (1997) used land survey record produced during the late 19th and early 20th centuries to reconstruct pre-European original vegetation patterns in the Darling Downs, Queensland, Australia. Bolliger et al. (2004) assessed ecological restoration potentials of Wisconsin, USA, using the data of U.S. General Land Office original PLS. The PLS datasets are widely recognized to provide reliable quantitative and qualitative information over landscapes, carried out in the 19th century from OH to the west coast of USA. The data also have been used to construct presettlement vegetation maps in many mid-western states (White and Mladenoff, 1994; Brown, 1998; Batek et al., 1999; Schulte et al., 2002). The records of land surveyors from periods of initial settlement were used by Fensham (1997) in North America to reconstruct bygone vegetation patterns. Foster (1992) used the proprietors’ grants, deeds and tax valuation lists, sale records, Harvard Forest (HF) Archives etc., to analyze the land-use history (1730-1990) and vegetation dynamics in central New England, USA. Besides, Jönsson (2009) used the timber surveys to reconstruct the approximate landscape-level abundance of large and intermediate diameter trees of Pinus and Picea. However, there are often big differences between historical data and current statistics due to the impact of economies, policies, wars and other factors, such as statistical standards, digital characteristics, richness (Ge, 2008), therefore revisions of these historical data were usually made before they could be used (He, 2011). And in this context, the second method is proposed: under some relatively reasonable assumptions, circumstantial evidence could be obtained from historical documents and then a quantitative land-cover analysis could be done based on its relationships with other variables, such as the relationship between cropland area and the rate of population change, urban-sprawl speed and the increasing population, or the pastural area and animals numbers. Some current related research methods generally incorporate assuming-index method, analogy and proxy method, method of quantitative section-comparison and adjustment with information symmetry incorporating multi-temporal data, and then the results are adjusted according to social, political and economic factors. The analogy method means comparing the similar data from a variety of sources to distinguish their connections and differences. The proxy method means that the data recorded indirectly could be replaced by similar ones according to different statistical standards. Method of quantitative section-comparison and adjustment with information symmetry incorporating multi-temporal data, obtains the land-use and land-cover data with the same statistical standards and characteristics from the different periods and types by finding the joint study range and data normalization treatment, as described in detail in Ge’s research (2008). Ye et al. (2009) reconstructed the reclamation changes in the past 300 years in Northeast China using the methods of adjusting the data from historical literatures and the model of relationships between multi-source cultivated-land data. Goldewijk (2001) assumed that there always should be some kinds of agricultural activities where people are living, especially in the past, and therefore he used population density as an acceptable proxy for the allocation of cropland and pasture when estimating global land use change over the past 300 years. Dahlström (2008) converted the numbers of livestock into livestock equivalents firstly and then into grazing equivalents in order to estimate the pasture area.As for the missing data in the past time series, researchers often fill the data gaps using backtracking model, retrospective interpolation method, and random Markov chain model. For example, based on the history of human settlement and patterns of economic development, Ramankutty and Foley (1999a) used the cropland data within a simple land cover change model, along with the historical inventory data, to reconstruct the global data on permanent cropland areas in 5 minute resolution from 1992 to 1700. Ge (2008) analyzed the spatial pattern change of arable land in Northeast China at regular time intervals based on retrospective interpolation method using the data in the basic year as the standard. Ramankutty and Foley (1999b) used the percentage of arable land as the cellular value to study the historical land changes. In conclusion, the general process to reconstruct land use and land cover based on historical documents is shown as follows (Figure 1).
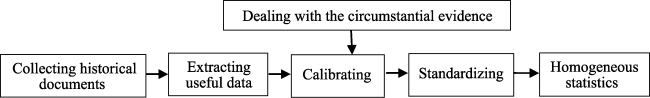
Figure 1 Land-cover reconstruction based on historical documents

2.2 Reconstruction based on historical maps and pictures

2.2.1 Reconstruction based on historical maps
Historical cartographic materials are useful for retrospective analysis of land cover patterns and their change over time (e.g., Kienast, 1993; Petit and Lambin, 2002). Historical maps (e.g., old cadastral maps, topographic maps, military maps, landscapes maps, thematic maps) containing land-cover information with temporal layer, can serve as a basis for the reconstruction of past land use and land cover, especially when they are used in a geographic information system (GIS). Comparisons of historical and modern maps highlight the major changes in land use and land cover. For some locations, historical land-cover data can be generated directly from historical maps. In general, the selection among old maps for land-use and land-cover change studies depends on when they were elaborated, their scale and the purpose of the study.
Cadastral maps were widely used in land-cover analysis, which were generated in almost all of the European countries in the 19th century. They are reliable and detailed, and can be used for evaluating the landscape microstructure. Historical cadastral maps have been used in Slovenia (Petek, 2004), in Germany (Bender et al., 2005), in Sweden (Cousins, 2002), in Norway (Domaas, 2007; Hamre, 2007), and also in the Czech Republic (Sklenicka et al., 2009). Cousins (2001) explored the possibility of using non-geometric cadastral maps from the 17th and 18th centuries to carry out land redistribution. Petek and Urbanc (2004) accomplished the reconstruction of historical rural landscape in Slovenia by taking advan-tage of maps from stable cadastre. Skaloš (2007) carried out a comparison of landscape developments in Sweden and in the Czech Republic by means of old cadastral maps. Historical cadastre maps were also used in studies of Domaas (2007) and Trpák (2002).
Besides, historical topographic maps, old vegetation maps and military survey maps are also common ones used for investigation of land-cover distribution. Stäuble et al. (2008) used the accurate topographic maps (e.g., the Napoleon map, the Dufour map and the National maps) since the mid-19th century to reconstruct historical landscape change in the Canton of Valais, Switzerland. Gimmi et al. (2011) analyzed wetland cover change over the past 150 years for the Canton Zurich, Switzerland, using information from historical and current topographical maps. The topographic sheets (“t-sheets”) of the US Coast and Geodetic Survey underline historical mapping of coastal wetlands and estuaries (e.g., Borde et al., 2003; Van Dyke and Wasson, 2005; Kearney et al., 1988). McLure and Griffiths (2002) input the data directly from historical maps and aerial photography into a digital elevation model (DEM), enabling users to create perspective views of the historical landscape of West Oxfordshire, England, from any elevation and view angle. The unique potential of the old maps was also used by the archeologists Williams (2007) and Barclay (2005). Skaloš et al. (2011) similarly researched long-term changes in the land cover of the Czech Republic from old military survey maps. Moreover, thematic maps also play essential roles in reconstructing historical specific vegetations. For example, drainage maps provide vital information on when and where wetlands vanished in the study area (Gimmi, 2011).
2.2.2 Reconstruction based on historical pictures
Pictures, especially photographs, often provide greater detail and realism about the land-cover than maps. Repeated photographs from the air or space can provide broad-scale perspectives of landscape to regional-scale land use/land cover change, thereby can overcome some biases of selecting specific and smaller localities. In the meantime, they are subject to distortion, since photographs are taken for specific purposes that may contain bias from the photographers. The use of historical aerial photographs to study land-use and cover change (LUCC) has been a well-established method in vegetation science (e.g., Swetnam et al., 1999) and has also been applied in erosion monitoring. Boucher et al. (2009) used a series of forest inventory maps, produced from aerial photographs during the past forest inventories, to reconstruct the transformation of the landscape in the 20th century. Schiefer (2007) reconstructed morphometric change in a proglacial landscape using historical aerial photography and automated DEM generation.
In conclusion, the general process (Figure 2) to make these data more accessible is firstly to scan original maps and aerial photos at high resolution, which is necessary due to high requirements for interpretation purposes and the quality of the historical maps and pictures. Secondly, the maps and pictures are rectified by choosing control points and then resampling (e.g., using polynominal equations) is carried out in a raster-based GIS to get the best fit. Finally, the maps and pictures are digitized in vector format and thus land-cover data are extracted. If the result proves to be unsatisfactory, new control points should be chosen or ncertain control points are omitted, and the transformation is repeated. The maps and pictures with GIS methods have been widely used in digitization due to the general availability of these maps and pictures in electronic form. The quality of the research depends on the accuracy of the historical maps and their potentiality to be integrated in a GIS.
Figure 2 Land-cover reconstruction based on historical maps and pictures

2.3 Reconstruction based on natural archives

The natural archives, which are also called “Geoarchives” or “proxy records”, are those “recorded” by earth-system processes, such as colluvial sediments (e.g., pollen, charcoal, plant macrofossils, and phytoliths, in ponds, lakes, bogs, and soils; Jackson et al., 1997), animal deposits (packrat middens; Betancourt et al., 1990), annual plant and animal growth cycles (e.g., tree rings and coral layers; Fritts, 1989), and other layered records (e.g., ice cores; Thompson et al., 1998) (Swetnam, 1999). They are subject to the filtering of past environmental information through physical and biological variables. This method has been widely used in reconstructing historical land use and land cover in the time scale of thousand years or even longer by palynologist, ecologist, archaeologist and geologist. Especially, the pollen and tree-ring analyses, which can allow the reconstruction of the local and regional vegetation composition and can reflect a region’s changing human activities, have been widely used. Fossil pollen, as the relic of historical plants, has been used extensively as an indicator of historical vegetation (e.g., Davis, 1973; Chen and Ni, 2008; Broström et al., 2008; Scharf, 2010). Reconstruction of vegetation from pollen analysis assumes that the spatial scale of vegetation represented by pollen assemblages can be understood, and that the inferred vegetation abundances can be translated into a vegetation map or other vegetation characteristics in specific applications. Over the last decades the development of a theoretical framework and models of pollen-vegetation relationships has made such spatial vegetation/landscape reconstruction feasible (Sugita, 1994; Dahlström, 2008). Research on modern relationships between pollen assemblages and human-induced vegetation related to various traditional human activities provides the foundation for an accurate interpretation of past human impact on vegetation and quantitative reconstruction of human-induced landscapes from fossil pollen data. There have been many examples of such research (Edwards, 1991; Hjelle, 1997; Gaillard et al., 2008; Brun, 2011; Li, 2013). The prime sources of information about forest development are tree rings (Esper et al., 2007), which allow precise dating of events. Researchers have gradually discovered that tree-ring index could evaluate the Normalized Difference Vegetation Index (NDVI) which reflects vegetation productivity, indicating that using tree-ring data could reconstruct historical land-cover. Malmstrom et al. (1997) had previously shown the potential of using the tree-ring width parameter for comparison with NDVI-based NPP estimates. Yuan (1989) reconstructed the long sequence of fodder grass output from tree-ring chronologies based on the relationships among tree-ring chronologies, fodder, grass and summer precipitation.

2.4 Model-based reconstruction

The early land use and land cover models are mainly the traditional natural cover models, carrying out climate-related method to project the vegetation distribution, such as General Circulation Models (GCMs) (Goldewijk, 2004) and Lund-Potsdam-Jena Dynamic Global Vegetation Model (LPJ) (Kaplan, 2012). These models project vegetation distribution mainly based on the relationship between temperature, precipitation and other climatic factors, but they do not fully consider the other factors such as soil, topography and human disturbance, which limit the system’s accuracy. Subsequently species-statistics method and growth-model have gradually replaced the climate-related method, such as the Gap model developed by Botkin which could simulate the biological changes in vegetation dynamics while considering non-climatic factors. Except for the aforementioned studies, some researchers have developed biophysics models based on the crop physiology while others developed crop-rotation models according to the interrelationship among various land-cover types (Benitez, 2004).
With the leading role of human activities on land use/cover change becoming increasingly prominent, historical reconstruction models of land use also give more consideration to both social and cultural factors. Initial studies mainly used a simple mechanical model to generate past projection at some certain assumptions without considering the driving forces and driving mechanism in the process of land use and land cover change. For example, Petit (2002) produced backward projections based on a mechanistic model which computes the demand for different land uses under the equilibrium assumption between the production and consumption of resources. Besides, he also believed landscape change processes can be simulated using linear, stochastic techniques such as Markov chains when a time series of land-cover maps is available. Ramankutty and Foley (1999a) used a ‘‘hindcast’’ modeling technique to extrapolate the data backwards in time by combining it with a compilation of historical cropland inventory data to create a dataset of croplands from 1700 to 1992.
Since the 1990s, land use/land cover reconstruction models have been developed along three important trends. Firstly, time dynamic simulation has been combined with spatial pattern analysis and geographic information systems. Secondly, remote sensing data have been widely used. Thirdly, natural elements have been integrated with social, economic and cultural elements (Chen, 2002).
Historical reconstruction of land use/land cover contains two important parts: the first part is to make clear the quantity of each land-cover and the second is to reconstruct the spatial pattern which is a process of spatial allocation. Numerical reconstruction could provide quantitative information for historical land-covers’ areas, which is the basis of land use reconstruction and also the premise of spatial reconstruction. Spatial reconstruction aims to distribute statistical data from numerical reconstruction into the geographical locations according to certain principles or approaches. Studies on historical reconstruction of land use/land cover usually aim to make clear the historical land-cover spatial distribution. As it is very difficult to obtain the land use/land cover data in the past, especially before the advent of satellite remote sensing, many researchers prefer to carry out land suitability evaluation using environmental background data (e.g., climate, soil, topography) and socioeconomic data (e.g., population and crop yield). Then they use land suitability evaluation map to exhibit the possible spatial distribution of historical land-cover. For specific spatial allocation, downscaling can be used in the descending order of distribution probability under the control of total land-cover area and other distribution factors (Figure 3).
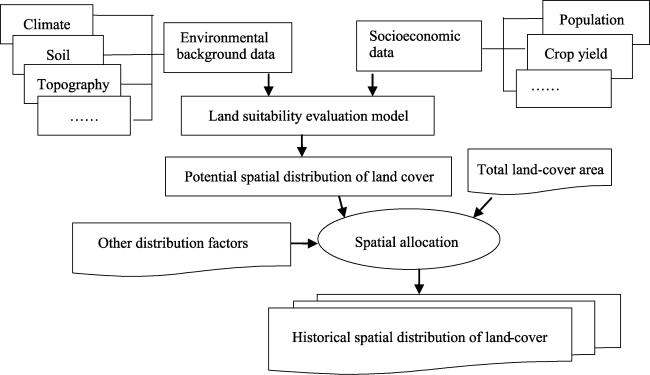
Figure 3 Land-cover reconstruction based on land suitability evaluation model
With modern remote sensing technology developing quickly, it becomes feasible and convenient to carry out earth observation in large-scale with high resolution. Thus an important reconstruction method has been developed to produce backward projections by nalyzing the land use and its change since the advent of remote sensing. This method is under the assumption of similarities between historical spatial pattern of land use and the present one. There are different approaches in this method. Zhu (2012) believed the approaches had various effects on controlling the similarities and summarized them to three types: totally dependent, partially dependent and dynamically dependent. Totally dependent approach was reasonably used in land-cover reconstruction closely related with human activity, such as arable land and pasture land in centennial time-scale. In order to avoid “using today’s pattern for historical reference”, partially dependent approach was based on an assumption that the area of historical agricultural activities could not exceed the present one. Dynamically dependent approach had the most sophisticated algorithms taking the time effect into consideration, firstly proposed by Goldewijk (2011) in his HYDE 3.1 (History Database of the Global Environment) application. The driving force of the land use process has to be clarified and the land use change trajectories have to be analyzed before using the partially dependent approach. Then a land use forecasting model (e.g., cellular automata (CA), Geomod) as a carrier can be used to produce backward simulation. The difference between historical reconstruction of land use/land cover and land-use change prediction lies in that the former could use historical maps, historical data and literatures, to revise the simulation model results. Besides, the former is a backward process while the latter, land-use change prediction, is a forward process to the future. Yet, both of them describe land-cover change over time and thus have the similar modeling theories and methods. Poska (2008) reconstructed the proportions of four classes of land-cover characteristics of cultural landscape: habitation area, arable land, grassland and woodland at Rõuge, South Estonia, for seven periods. Mao (2010) also used this model to rebuilt land use and land cover of Baicheng city, China, from 1890 to 2029 and then studied the soil organic carbon pool. Bai (2004, 2007) used TM (thematic mapper) and MSS (multispectral scanner) images, physical environmental background maps and socioeconomic data to design a new diagnostic model of land utilization spatial information in historical period based on CA model. Pontius (2003) reconstructed the landscapes of Massachusetts Ipswich River basin in 1951 using the Geomod model. Lv (2012) also discussed the historical LUCC researches in Northeast China using this model based on the application of toponymy and other correlative historical data to acquire the information of the beginning period of large-scale land reclamation. Pontius (2001) simulated the progressive loss of closed-canopy forest in Costa Rica for 1940, 1961 and 1983 with Geomod2 and then simulated the location of land-use change over several decades.
Studying land-reconstruction methods in depth becomes the key of studying the long-period land use and land cover dynamics. Especially, studies by modeling in particular may be prone to promoting proper forecasts, projections or predictions (Veldkamp and Lambin, 2001). The more complex the system is and the more factors are involved, the more difficult it is to make acceptable predictions.

2.5 Reconstruction based on multiple-source data and multidisciplinary analysis

Each single method has limitations and advantages, and subsequently most studies benefit from using multiple approaches (Foster et al., 1996). Researchers usually combined several of the above methods to reconstruct the composition and structure of land cover. By combining different data sources, they often obtained a more complete picture of land-use and land-cover change. For example, historical rural land use and settlement structure have large regional and temporal variations and the reconstruction of a specific historical land-cover can only be done by a high-resolution local case study (e.g. Sarmaja-Korjonen, 1992). The critical assumption for such reconstruction is the availability of relevant and reliable historical documents. As historical sources are chronologically and regionally unevenly preserved, the combined usage of different records is inevitable (Petit and Lambin, 2002; Nielsen and Odgaard, 2004). Large-scale cadastral maps, historical census data, taxpayers lists and plough-land revisions contain valuable information about historical land use, settlement structure, demographic and economic parameters (Foster et al., 1998; Fuller et al., 1998; Cousins, 2001). Recognizing the challenges of assessing the accuracy of historical mapping (Harley, 1989), Robin (2007) used multiple document types to enable triangulation, or cross-referencing, of independent data sources to reconstruct historical land cover in California’s Santa Clara Valley and the findings suggested that the triangulation of overlapping from different data sources might be more useful than the independent data sources. Zhang et al. (2006) rebuilt LUCC spatial-temporal distribution over the past century in Northeast China by using many sources of data and by modeling, such as TM and MSS images, physical environmental background maps including terrain, climate, geology, soil, vegetation and hydrology as well as socioeconomic statistical data. To reconstruct the historical landscape ecology of an urbanized California valley, Grossinger (2007) examined several thousand historical records at over two dozen archival institutions and collected materials and their archival provenance, including Spanish explorers’ accounts, Mexican land grant maps and court testimony, PLS records, early city and county maps, early American journals and histories, 19th-century paintings and drawings, US Geological Survey maps, US Coast and Geodetic Survey maps, landscape paintings and photography, aerial photography, soil surveys and ecological research/collections. Hamre (2007) used an old cadastral map, a field survey of the present landscape and GIS to quantify and analyze land-cover changes in a western Norwegian cultural landscape since the time of land consolidation (1865) until 2002; Skaloš (2010) tested a method for analyzing long-term structural changes in non-forest wood elements using five main sources of data: official statistical data on land cover in the Czech Republic, stable cadastre maps from 1839 and 1843, aerial photographs, field maps and the digital map of the territory (DMU) on a scale of 1:25,000.
Moreover, researchers face the difficulties like inaccuracy reconstruction and unverified historical data due to the limits of their own disciplinary knowledge. With the widely application of multidisciplinary studies, they gradually become aware of the fact that different types of historical data might provide useful information for different land cover types, and then studied the historical land use reconstruction by integrating paleoecology, paleogeography, historical landscape science, palaeobotany, palaeophysiography, history and other disciplines. By this way they could reconstruct historical land-cover from multiple perspectives, complement the missing data, verify reconstruction results and then improve reconstruction results. For example, in southern Sweden, information about land-cover collected from different historical sources including old maps was compared with pollen diagrams from ten sites and other palaeoecological records (Berglund, 1991; Nielsen, 2004); Wulf (2010) used a combined approach of GIS-techniques and historical reconstructions from archives to study forest cover changes in the Prignitz region, Northeast Germany, between 1790 and 1960 in relation to soils and other diving forces. “BIOME 300” project, a joint LUCC-PAGES (Past Global Changes) initiative (Leemans et al., 2000), was initiated to reconstruct historical land use/land cover datasets for the past 300 years using data from several disciplines such as paleo-data from pollen records. The participation of scientists from around the world with expertise in their own particular regions of study is required in these global efforts. In short, integration of different methods and data sources could extend the environmental change information in different spatial and temporal scales, which has good prospects in future applications.

3 Advantages and constrains

None of the individual approaches mentioned above provide a basis for a comprehensive, integrated and spatially explicit model to simulate future land-use change in a complex modern society (Lin, 2005; Parker, 2003). Each of them has its own suitable spatial and temporal scales (Table 1).
Table 1 Advantages and constrains of reconstruction methods and their suitable spatial and temporal scales
Advantages Constrains Suitable spatial and temporal scales
Reconstruction based on historical documents 1. Accessible data
2. Huge amount of land-cover information and great variety
3. Widely used in numerical reconstruction
1.Time-consuming to collect
2. Fragmentary
3. Inaccurate and missing information
4. Qualitative or semi-quantitative data
5. Different meaning with that of today
6. Recorded in administrative units with fuzzy spatial information
1. Millennium time-scale
2. From regional to national scales
Reconstruction based on historical maps and pictures 1. Visual information
2. Abundant spatial quantitative information
1. Errors, inconsistencies and inaccuracies
2. Geometrical irregularities
3.Un-unified land cover classification
4. Missing certain boundaries in some classes of land covers
1. Centennial time-scale
2. Regional scale
Reconstruction based on natural archives 1. Providing accurate spatial details of land use
2. With long time span
1. Not easily available.
2. With great limits of certain land-cover type
1.Millennial time-scale or longer
2. Regional scale
Model-based reconstruction 1. Driving forces and driving mechanism of land use
3. Quantitatively spatial land cover.
1. High quality data acquisition and input parameters
2. Incomplete reconstruction system
3. Few historical land-cover datasets with high spatial accuracy
1. From decadal to millennial time-scales
2. From regional to global scales
Reconstruction based on multiple-source data and multidisciplinary analysis 1. Multiple perspectives
2. Complementing missing data and verifying reconstruction results
1. Difficult to couple various types of data
2. Few all-round researchers with multidisciplinary backgrounds
Unlimited
(1) Historical documents contain qualitative or semi-quantitative information about the past land-cover, which are the main data source of studying historical LUCC from regional to global scales. They are often recorded in administrative units such as town, county, city and province. However, they usually contain a huge amount of land-cover data. Preparation of archival documents is very time-consuming (Hu et al., 2012; He et al., 2000; Wulf, 2011) and data quality varies greatly. On the other side, some historical records are often too brief or fragmentary to be useful, or they are not accessible for the process or structure of interest. In many cases, researchers have to estimate and make informed guesses in order to fill in the lacuna in data from discontinuous documentation or they have to find ways to incorporate qualitative information. Furthermore, some old documents about oral history, such as notesof surveyors, general description by travelers’ and farmers’ diaries, have an obvious limitation: the temporal span is limited by life expectancy (Bürgi, 2007). Any interpretation of oral histories must address the question of faulty memories and biases (Perks and Thomson, 1998). Last but not least, historical records, which are especially relevant for land-use change studies, are often too simple to meet rigorous ecologists’ demand for quantification (Whitney, 1996). And because the historical data sources were originally created for other purposes, they may lack the precision or detail needed for quantitative analysis. They may also lack sufficient spatial resolution, with fuzzy information on locations, although some field and survey data, such as PLS, contains quantitative, real and accurate spatial data (Schulte, 2001). However, these field and survey data just cover a regional scale and the records are broadly useful in documenting the ecological conditions of a specific period or under a certain management regime. Taken together, historical documents plays an important role in numerical reconstruction of past land use and land cover.
(2) Many studies prove that the most valuable materials for land-cover reconstruction are detailed historical maps and pictures, as historical land cover could be extracted directly from them. Researchers can reconstruct the spatial distribution and carry out a quantitative approach about the past land cover. However, historical maps have a variety of limitations that must be considered to accurately interpret apparent land cover change. Historical maps and pictures are often obtained in individual regions and they can only be used in regional scale and in the past centuries, with strict limits of spatial and temporal scales. Maps, especially historical maps, may contain errors, inconsistencies and inaccuracies. Some of them might be completely wrong for political and military intelligence reasons of the given time (Draganits, 2008). For example, military maps are limited by the fact that they were created for specific military purposes, and by the methods used in elaborating them at the time when they were made. Therefore, in close cooperation with historians and cartographers, researchers should carefully check the maps for their contents, age, details of their production, cartographic parameters, and historical circumstances, etc., to exclude possible pitfalls as much as possible. In addition, there are other four constrains using historical maps to reconstruct land cover as follows: 1) The mapping criteria of the past is not totally the same with today’s and it is often difficult to find the historical mapping instructions. 2) An obstacle in the previous studies using historical maps is that they have geometrical irregularities compared to modern maps due to surveyor’s purpose and the technical factors. Unless this is taken into consideration, and without correctly transforming the maps, it is hard to make accurate spatial analysis of land-cover change. 3) Each map shows its own land cover classes mainly based on its purpose and criteria. Thus, researchers must first produce a map series with unified contents. 4) Some classes of land covers have their own certain boundaries (e.g., lakes, rivers, hamlets, and wetlands), and the boundaries of forest are difficult to be distinguished from those of arable land, for example. So it is very difficult to extract and digitize the spatial explicit forest and arable data.
(3) Natural archive has apparent advantages as a method for reconstructing past vegetation and has its unique possibilities for the study of time periods where historical records are lacking (Dahlström, 2008). This method is suitable for millennial time-scale or even longer, yet its accuracy depends on the accuracy of the measurements, as well as on the attitude, bias, and agenda of the measurers. A measurement may vary according to tool, season, or calibration. A description of the former landscape may be scientific or lyric, detailed or general, but perhaps very pertinent to the questions being asked. Researchers using historical sources must also pay special attention to correlations masked as causations. This approach was widely used to reconstruct paleoclimate, paleoecology and paleo-vegetation while it is also gradually being used to analyze historical land use/cover change. Given that there are suitable sediments to core, there is the possibility for work at various spatial and temporal scales with pollens as the direct link to past vegetation. Although pollen analyses give an opportunity for reconstructing the relative changes in vegetation and land use in a very long-term perspective, there are still limitations when the pollen content is interpreted in terms of spatial distribution of vegetation and land use. The approaches of pollen analysis have the following disadvantages: 1) one pollen taxon may be indicative of several land-uses, which makes interpretation and classification into land-use groups difficult; and 2) interpretation of changes in the percentages (or influx) of groups of pollen indicators may be misleading because of the subjectivity of the grouping itself and because of our limited understanding of the effects of different land-uses on pollen percentages and influx. Interpretations of pollen diagrams often lack estimates of areas with different vegetation types within the landscape. Tree rings could only be used to reconstruct historical forest, with great limits of other land-cover types.
(4) Historical reconstruction models can be built and are in the process of continuous improvement. It has been gradually developed from static models to dynamic ones and from empirical models to mechanistic ones. The current reconstruction models can improve our understanding of the process of land use and land cover change, and can also help clarify the driving force and driving mechanism in quantitatively reconstructing spatial land cover. It has highly flexible application both in numerical reconstruction and spatial reconstruction. However, current models require high quality of data acquisition and input parameters. There is still an incomplete system for reconstruction modeling and few historical land-cover dataset with high spatial accuracy. These make the reconstruction results have ineffective applications in simulations of climatic and ecological effects. Researchers now focus on the transformation from the indirect indicators of land cover such as reclamation rate into spatial grid of land-use types.
(5) Different types of historical documents might provide useful information for different land cover types. The reconstruction method based on multiple-source data and multidisciplinary analysis attracts researchers’ attention. This method aims to combine different approaches into one hybrid model to take the advantages of each module. The method could reconstruct historical land-cover from multiple perspectives, complement missing data, verify reconstruction results and improve reconstruction accuracy. But there are certain difficulties to couple various sources and various types of data. Sometimes it is also very difficult to find all-round researchers with multidisciplinary backgrounds, so an interdisciplinary research team is usually formed that is proficient in paleoecology, paleogeography, historical landscape science, palaeobotany, palaeophysiography, history and other disciplines. This method is still in its exploratory stage.

4 Discussion and conclusions

Reconstructions of the past land use and land cover are usually involved with limited aspects of the spatial-temporal ranges. This is to some extent determined by the methods within a discipline. For example, archaeology can give very exact spatial information about land use but is usually lacking in time resolution. Different historical disciplines provide possibilities for studying land use at various spatial and temporal scales of resolution, within the limits by the availability of written sources and their interpretation (Dahlström, 2008). Historical documents generally have clear temporal properties with resolution of year and month. In comparison, the document-derived vegetation information is usually better dated than fossil pollen records because the latter dating mostly relies on radiocarbon with an uncertainty range of multi-decades at least. Moreover, only plants’ family and genus could be identified from the follies pollen while the plants’ species could be identified from documental records. Therefore, for the scale of past centuries, historical documents are more suitable to study vegetation status than fossil pollen. Historical sources can show dynamics on the fine spatial-temporal scales that are difficult to capture with pollen analysis. On the other hand, pollen analysis has unique possibilities for the study of time periods where historical records are not available. Therefore the combination of several disciplines is likely to be productive in understanding the past land use and vegetation. However, there are still relatively few studies that have combined knowledge from multi-disciplines such as ecology, agricultural history and geography in order to produce syntheses of land use change during recent centuries (e.g. Cousins, 2002; Motzkin et al., 2002; Dahlström et al., 2006). Historical records and pollen analysis are complementary, so the combination of agricultural history and palaeoecology is likely to be useful in understanding the past land use.
In addition, the most valuable and basic materials for land-cover reconstruction are still detailed historical maps, which are significant to construct datasets of historical land use and land cover change with spatial details. The old maps offer an ideal way to acquire data on structure of the historical landscape. To reconstruct historical land-cover in a more effective way by using historical maps, researchers should consider the following suggestions: (1) as the surveyors’ classifications systems varied it is necessary to perform generalizations; and (2) it is necessary to use an efficient method to extract data into digital format. If too many land-cover types were used, there would be apparent changes simply due to different labeling of the same class by different surveyors. As valuable historical land-cover data are usually not free from errors, old maps and other historical sources must be used carefully, with the limitations in the interpretation of land cover and land use (Dahlström, 2008; Nielsen and Odgaard, 2004).
In summary, historical sources, after all, reflect the past but are not the past itself. A description of the past land use and land cover may be scientific or lyric, detailed or general, but can be very pertinent to the questions being asked. Researchers using historical sources must also pay special attention to correlations masked as causations. To help compensate for the subjectivity of historical documents, researchers should combine several sources of information and focus on the application of multidisciplinary knowledge. Throughout the overall development path, the reconstruction methods of land use and land cover have developed gradually from the initial qualitative analysis based on historical documents to quantitative analysis based on multiple-source data and multidisciplinary research. The latter is still in the exploratory stage. With certain difficulties to couple various sources and various types of data and with the difficulty to find all-round researchers with multidisciplinary backgrounds, the reconstruction method based on multiple-source data and multidisciplinary analysis might not play a critical role in the short term. But it is a goal in future long-term development for the historical land-cover reconstruction.
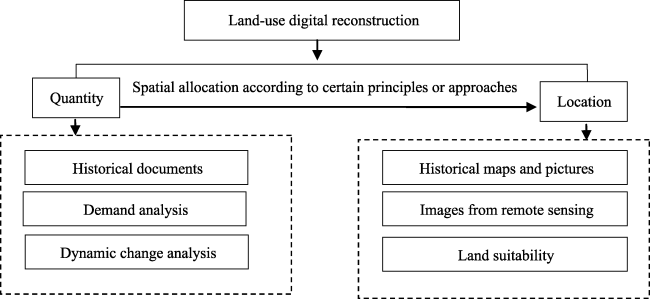
Figure 4 Reconstruction framework of historical land use
Historical reconstruction of land use/land cover aims to reproduce the past land use information, not only in the quantity of land use/cover in a historical period, but also in the spatial distribution (Figure 4). The land-cover quantity could be determined from historical ocuments, demand analysis and deduction of current land-use change, while spatial location of land cover should be determined by historical maps and pictures, images from remote sensing and land suitability analysis. Current researches mainly focus on revising the historical land-cover quantity. There are few historical land-cover datasets with high spatial accuracy resulting in ineffective applications of the study results in simulations, such as in climatic and ecological effects. As the advanced computing technology provides the possibility of digital reconstruction, we should put an emphasis on reconstruction models in short term and on the transformation from the indirect indicators of land cover such as reclamation rate into spatial grid of land-use types. It should be a research direction to build historical spatial land use and land cover datasets with high resolution.

The authors have declared that no competing interests exist.

1
Bai Shuying, Zhang Shuwen, 2004. The discussion of the method of land utilization spatial information reappearance of history period. Journal of Arid Land Resources and Environment, 18(5): 77-80. (in Chinese)

2
Bai Shuying, Zhang Shuwen, Zhang Yangzhen, 2007. Digital rebuilding of LUCC spatial-temporal distribution of the last 100 years: Taking Dorbod Mongolian Autonomous County in Daqing City as an example.Acta Geographica Sinica, 62(4): 427-436. (in Chinese)

3
Bakker M M, Govers G, Kosmas Cet al., 2005. Soil erosion as a driver of land-use change. Agriculture, Ecosystems, and Environment, 105(3): 467-481.

4
Barclay G, 2005. Farmers, Temples and Tombs (Making of Scotland). Edinburgh: Birlinn Press, 64.

5
Batek M J, Rebertus A J, Schroeder W Aet al., 1999. Reconstruction of early nineteenth-century vegetation and fire regimes in the Missouri Ozaks.Journal of Biogeography, 26(2): 397-412.

6
Bender O, Boehmerb H J, Jens Det al., 2005. Using GIS to analyse long-term cultural landscape change in Southern Germany.Landscape and Urban Planning, 70(1): 111-125.

7
Benitez J A, Fish T R, 2004. Historical Land-cover Conversion (1665-1820) in the Choptank Watershed, eastern United States.Ecosystems, 7(3): 219-232.

8
Berglund B E, 1991. The cultural Landscape during 6,000 Years in Southern Sweden: The Ystad Project (Vol.41). Munksgaard International Booksellers and Publishers.

9
Betancourt J L, Van Devender T R, Martin P S, 1990. Packrat Middens: The Last 40 000 Years of Biotic Change. Tucson: University of Arizona Press.

10
Bolliger J, Schulte L A, Burrows S Net al., 2004. Assessing ecological restoration potentials of Wisconsin (USA) using historical landscape reconstructions.Restoration Ecology, 12(1): 124-142.

11
Bolstad P V, Swank W T, 1997. Cumulative impacts of land use on water quality in a southern Appalachian watershed.Journal of the American Water Resources Association, 33(3): 519-533.

12
Borde A B, Thom R M, Rumrill Set al., 2003. Geospatial habitat change analysis in Pacific Northwest coastal estuaries.Estuaries, 26(4): 1104-1116.

13
Boucher Y, Arseneault D, Sirois Let al., 2009. Logging pattern and landscape changes over the last century at the boreal and deciduous forest transition in Eastern Canada.Landscape Ecology, 24(2): 171-184.

14
Broström A, Nielsen A B, Gaillard M Jet al., 2008. Pollen productivity estimates of key European plant taxa for quantitative reconstruction of past vegetation: A review.Veget Hist Archaeobot, 17: 461-478.

15
Brown D G, 1998. Mapping historical forest types in Baraga County Michigan, USA, as fuzzy sets.Plant Ecology, 134(1): 97-111.

16
Brun C, 2011. Anthropogenic indicators in pollen diagrams in eastern France: A critical review.Veget Hist Archaeobot, 20(2): 135-142.

17
Bürgi M, Hersperger A M, Hall M et al., 2007. Using the past to understand the present land use and land cover. In: A Changing World. Netherlands: Springer, 133-144.

18
Chen Siqing, 2002. Study on land-use/cover change and carbon cycle of Xilin River Basin, Inner Mongolia based on remote sensing and GIS. Beijing: Institute of Remote Sensing Applications, CAS. (in Chinese)

19
Chen Y, Ni J, 2008. Quantitative palaeovegetation reconstruction at large scale based on pollen records.Journal of Plant Ecology, 32: 1201-1212. (in Chinese)

20
Cogbill C V, Burk J, Motzkin G, 2002. The forests of presettlement New England, USA: Spatial and compositional patterns based on town proprietor surveys.Journal of Biogeography, 29(10/11): 1279-1304.

21
Cousins S A, 2001. Analysis of land-cover transitions based on 17th and 18th century cadastral maps and aerial photographs. Landscape Ecology, 16: 41-54.

22
Cousins S A, Eriksson Åsa, Franzén Daniel, 2002. Reconstructing past land use and vegetation patterns using palaeogeographical and archaeological data. A focus on grasslands in Nynas by the Baltic Sea in south-eastern Sweden.Landscape and Urban Planning, 61: 1-18.

23
Dahlström A, 2008.Grazing dynamics at different spatial and temporal scales: Examples from the Swedish historical record A.D.1620-1850.Vegetation History and Archaeobotany, 17(5): 563-572.

24
Dahlström A, Cousins S A, Eriksson O, 2006. The history (1620-2003) of land use, people and livestock, and the relationship to present plant species diversity in a rural landscape in Sweden.Environment and History, 12: 191-212.

25
Davis M B, 1973. Pollen evidence of changing land use around the shores of Lake Washington.Northwest Science, 47(3): 133-148.

26
DeFries R S, Eshleman K N, 2004. Land-use change and hydrologic processes: A major focus for the future. Hydrological Processes, 18(11): 2183-2186.

27
de Sherbinin A, 2002. Land use and land cover change: A CIESIN thematic guide. Center for International Earth Science Information Network, Columbia University, Palisades, NY.

28
Domaas S T, 2007. The reconstruction of past patterns of tilled fields from historical cadastral maps using GIS.Landscape Research, 32(1): 23-43.

29
Draganits E, Zámolyi A, Székely B et al., 2008. Reconstruction of the Neusiedlersee (Austria/Hungary) based on historical topographic maps from 1507 to present. In: Geophysical Research Abstracts, 10: 08644.

30
Dupouey J L, Dambrine E, Laffite J Det al., 2002. Irreversible impact of past land use on forest soils and biodiversity.Ecology, 83(11): 2978-2984.

31
Edwards K J, MacDonald G M, 1991. Holocene palynology: II. Human influence and vegetation change.Progress in Physical Geography, 15(4): 364-391.

32
Esper J, Frank D C, Luterbacher J, 2007. On selected issues and challenges in dendroclimatology. In: A Changing World. Netherlands: Springer, 113-132.

33
Fensham R J, Fairfax R J, 1997. The use of the land survey record to reconstruct pre-European vegetation patterns in the Darling Downs, Queensland, Australia.Journal of Biogeography, 24(6): 827-836.

34
Foster D R, 1992. Land-use history (1730-1990) and vegetation dynamics in central New England, USA.Journal of Ecology, 80: 753-772.

35
Foster D R, Motzkin G, Slater B, 1998. Land-use history as long-term broad-scale disturbance: Regional forest dynamics in central New England. Ecosystems, 1(1): 96-119.

36
Foster D R, Orwig D A, McLachlan J S, 1996. Ecological and conservation insights from reconstructive studies of temperate old-growth forests.Trends in Ecology and Evolution, 11(10): 419-424.

37
Foster D R, Swanson F, Aber J Det al., 2003. The importance of land-use legacies to ecology and conservation.BioScience, 53(1): 77-88.

38
Fritts H C, Swetnam T W, 1989. Dendroecology: A tool for evaluating variations in past and present forest environments.Advances in Ecological Research, 19: 111-189.

39
Fuller J L, Foster D R, McLachlan J Set al., 1998. Impact of human activity on regional forest composition and dynamics in central New England.Ecosystems, 1: 76-95.

40
Gaillard M J, Sugita Set al., 2008. Human impact on terrestrial ecosystems, pollen calibration and quantitative reconstruction of past land-cover.Veget Hist Archaeobot, 17: 415-418.

41
Ge Quansheng, Dai Junhu, He Fannenget al., 2003. Study on cultivated land quantity change and driving factors in some provinces in China over the past 300 years.Natural Science Bulletin, 13(8): 825-832. (in Chinese)

42
Ge Quansheng, Dai Junhu, He Fannenget al., 2008. The land use/land cover change and the carbon cycle in China in the past 300 years.Science in China, 38(2): 197-210. (in Chinese)

43
Gimmi U, Lachat T, Bürgi M, 2011. Reconstructing the collapse of wetland networks in the Swiss lowlands 1850-2000.Landscape Ecology, 26(8): 1071-1083.

44
Goldewijk K K, 2001. Estimating global land use change over the past 300 years: The HYDE database.Global Biogeochemical Cycles, 15(2): 417-433.

45
Goldewijk K K, Battjes J J, 1997. A hundred year (1890-1990) database for integrated environmental assessments (HYDE, version 1.1). National Institute of Public Health and the Environment (RIVM), Bilthoven, The Netherlands.

46
Goldewijk K K, Beusen A, Van Drecht Get al., 2011. The HYDE 3.1 spatially explicit database of human-induced global land-use change over the past 12,000 years.Global Ecology and Biogeography, 20(1): 73-86.

47
Goldewijk K K, Ramankutty N, 2004. Land cover change over the last three centuries due to human activities: The availability of new global data sets.GeoJournal, 61(4): 335-344.

48
Gragson T L, Bolstad P V, 2006. Land use legacies and the future of southern Appalachia.Society and Natural Resources, 19(2): 175-190.

49
Grossinger R M, Striplen C J, Askevold R Aet al., 2007. Historical landscape ecology of an urbanized California valley: Wetlands and woodlands in the Santa Clara Valley.Landscape Ecology, 22(1): 103-120.

50
Hamre L N, Domaas S T, Austad Iet al., 2007. Land-cover and structural changes in a western Norwegian cultural landscape since 1865, based on an old cadastral map and a field survey.Landscape Ecology, 22(10): 1563-1574.

51
Harding J S, Benfield E F, Bolstad P Vet al., 1998. Stream biodiversity: The ghost of land use past.Proceedings of the National Academy of Sciences, 95(25): 14843-14847.

52
Harley J B, 1989. Historical geography and the cartographic illusion.Journal of Historical Geography, 15(1): 80-91.

53
He Fanneng, Li Shicheng, Zhang Xuezhen, 2011. The reconstruction of cropland area and its spatial distribution pattern in the mid-northern Song Dynasty.Acta Geographica Sinica, 66(11): 1531-1539. (in Chinese)

54
He H S, Mladenhoff D J, Sickley T Aet al., 2000. GIS interpolations of witness tree records (1839-1866) for northern Wisconsin at multiple scales.Journal of Biogeography, 27(4): 1031-1042.

55
Hjelle K L, 1997. Relationships between pollen and plants in human-influenced vegetation types using presence-absence data in western Norway.Review of Palaeobotany and Palynology, 99(1): 1-16.

56
Houghton R A, 2003. Revised estimates of the annual net flux of carbon to the atmosphere from changes in land use and land management 1850-2000. Tellus, Series B: Chemical and Physical Meteorology, 55(2): 378-390.

57
Hu Ningke, Li Xin, 2012. A review of research methods of historical land use change. Advances in Earth Science, 27(7): 758-768. (in Chinese)

58
Huston M A, 2005. The three phases of land-use change: Implications for biodiversity.Ecological Applications, 15(6): 1864-1878.

59
Jackson S T, Overpeck J T, Keattch S Eet al., 1997. Mapped plant-macrofossil and pollen records of late Quaternary vegetation change in eastern North America. Quaternary Science Reviews, 16(1): 1-70.

60
Jones K B, Neale A C, Nash M Set al., 2001. Predicting nutrient sediment loadings to streams from landscape metrics: A multiple watershed study from the United States Mid-Atlantic region.Landscape Ecology, 16(4): 301-312.

61
Jönsson M T, Fraver S, Jonsson B G, 2009. Forest history and the development of old-growth characteristics in fragmented boreal forests.Journal of Vegetation Science, 20(1): 91-106.

62
Kaplan J O, Krumhardt K M, Zimmermann N E, 2012. The effects of land use and climate change on the carbon cycle of Europe over the past 500 years.Global Change Biology, 18(3): 902-914.

63
Kearney M S, Grace R E, Stevenson J C, 1988. Marsh loss in Nanticoke Estuary, Chesapeake Bay.Geographical Review, 78: 205-220.

64
Kienast F, 1993. Analysis of historic landscape patterns with a Geographical Information System: A methodological outline.Landscape Ecology, 8(2): 103-118.

65
Leemans R, Goldewijk K K, Oldfield F, 2000. Developing a fast-track global database of land-cover history.LUCC Newsletter, (5): 6-7.

66
Li Jianyong, Xu Qinghai, Gaillard-Lemdahl M Jet al., 2013. Modern pollen and land-use relationships in the Taihang Mountains, Hebei province, northern China: A first step towards quantitative reconstruction of human-induced land cover changes.Veget Hist Archaeobot, 22: 463-477.

67
Lin Qing, Luo Geping, Chen Xi, 2005. Review of land-use model.Progress in Geography, 24(5): 79-87. (in Chinese)

68
Liu Jiyuan, 1996. Resources Macro-scale Survey and Dynamics in China. Beijing: China Science and Technology Press. (in Chinese)

69
Liu Jiyuan, Liu Mingliang, Zhuang Dafanget al., 2002. The recent spatial pattern of land use change in China.Scientia Sinica Terrae, 32(12): 1031-1040. (in Chinese)

70
Lv Yan, 2012. The spatial reconstruction of land use/land cover in the early reclaimed time of the western Jilin Province. Changchun: Jilin University. (in Chinese)

71
Lv Yan, Zhang Shuwen, Yang Jiuchun, 2010. Application of toponymy to the historical LUCC researches in Northeast China: Taking Zhenlai county of Jilin province as an example.Journal of Geo-Information Science, 12(2): 174-179. (in Chinese)

72
Mao Zilong, 2010. The research on land use/land cover change and soil organic carbon pool in Baicheng city during 1890-2029. Changchun: Jilin University. (in Chinese)

73
Marcucci D J, 2000. Landscape history as a planning tool.Landscape and Urban Planning, 49(1): 67-81.

74
McLure J T, Geoffrey G H, 2002. Historic landscape reconstruction and visualisation, West Oxfordshire, England.Transactions in GIS, 6(1): 69-78.

75
Motzkin G, Eberhardt R, Hall Bet al., 2002. Vegetation variation across Cape Cod, Massachusetts: Environmental and historical determinants.Journal of Biogeography, 29(10/11): 1439-1454.

76
Nielsen A B, Odgaard B, 2004. The use of historical analogues for interpreting fossil pollen records.Vegetation History and Archaeobotany, 13(1): 33-43.

77
Parker D C, Manson S M, Janssen M Aet al., 2003. Multi-agent systems for the simulation of land-use and land-cover change: A review.Annals of the Association of American Geographers, 93(2): 314-337.

78
Pearson S G, Turner M G, Drake J B, 1999. Landscape change and habitat availability in the southern Appalachian highlands and Olympic peninsula.Ecological Applications, 9(4): 1288-1304.

79
Perks R, Thomson A, 1998. The Oral History Reader. Psychology Press.

80
Petek F, Urbanc M, 2004. The Franziscean land cadastre as a key to understanding the 19th-century cultural landscape in Slovenia.Acta Geographica Slovenica, 44(1): 89-113.

81
Petit C C, Lambin E F, 2002. Long-term land-cover changes in the Belgian Ardennes (1775-1929): Model-based reconstruction vs. Historical maps.Global Change Biology, 8(7): 616-630.

82
Pontius Jr R G, Agrawal A, Huffaker D, 2003. Estimating the uncertainty of land-cover extrapolations while constructing a raster map from tabular data.Journal of Geographical Systems, 5(3): 253-273.

83
Pontius Jr R G, Cornell J D, Hall C A S, 2001. Modeling the spatial pattern of land-use change with GEOMOD2: Application and validation for Costa Rica. Agriculture, Ecosystems and Environment, 85(1): 191-203.

84
Poska A, Sepp E, Veski Set al., 2008. Using quantitative pollen-based land-cover estimations and a spatial CA_Markov model to reconstruct the development of cultural landscape at Rõuge, South Estonia.Veget Hist Archaeobot, 17: 527-541.

85
Ramankutty N, Foley J A, 1999a. Estimating historical changes in global land cover: Croplands from 1700 to 1992.Global Biogeochemical Cycles, 13(4): 997-1027.

86
Ramankutty N, Foley J A, 1999b. Estimating historical changes in land cover: North American croplands form 1850-1992.Global Ecology and Biogeography, 8(5): 381-396.

87
Russell E W B, 1997. People and the Land through Time: Linking Ecology and History. Yale University Press.

88
Sala O E, Chapin F S, Armesto J Jet al., 2000. Global biodiversity scenarios for the year 2100.Science, 287(5459): 1770-1774.

89
Sarmaja-Korjonen K, 1992. Fine-interval pollen and charcoal analyses as tracers of early clearance periods in S Finland. Acta Botanica Fennica, 146: 1-75.

90
Scharf E A, 2010. Archaeology, land use, pollen and restoration in the Yazoo Basin (Mississippi, USA).Veget Hist Archaeobot, 19: 159-175.

91
Schiefer E, Gilbert R, 2007. Reconstructing morphometric change in a proglacial landscape using historical aerial photography and automated DEM generation. Geomorphology, 88(1): 167-178.

92
Schneider N, Eugster W, 2007. Climatic impacts of historical wetland drainage in Switzerland.Climatic Change, 80(3/4): 301-321.

93
Schulte L A, Mladenoff D J, 2001. The original U.S. Public Land Survey Records: Their use and limitations in reconstructing presettlement vegetation.Journal of Forestry, 99(10): 5-10.

94
Schulte L A, Mladenoff D J, Nordheim E V, 2002. Quantitative classification of a historic northern Wisconsin (U.S.A.) landscape: Mapping forests at regional scales.Canadian Journal of Forest Research, 32(9): 1616-1638.

95
Sinclair A R E, Hik D S, Schmitz O Jet al., 1995. Biodiversity and the need for habitat renewal.Ecological Applications, 5: 579-587.

96
Skaloš J, 2007. Czech and Swedish intensively utilised agricultural landscape-parallels and divergences during the last 300 years.Journal of Landscape Ecology, 0: 135-162.

97
Skaloš J, Engstova B, 2010. Methodology for mapping non-forest wood elements using historic cadastral maps and aerial photographs as a basis for management.Journal of Environmental Management, 91(4): 831-843.

98
Skaloš J, Weber M, Lipský Zet al., 2011. Using old military survey maps and orthophotograph maps to analyse long-term land cover changes: Case study (Czech Republic).Applied Geography, 31(2): 426-438.

99
Sklenicka P, Molnarova K, Bravec Eet al., 2009. Remnants of medieval field patterns in the Czech Republic: Analysis of driving forces behind their disappearance with special attention to the role of hedgerows.Agriculture, Ecosystems and Environment, 129(4): 465-473.

100
Stäuble S, Martin S, Reynard E, 2008. Historical mapping for landscape reconstruction: examples from the Canton of Valais (Switzerland).Mountain Mapping and Visualisation, 211-217.

101
Sugita S, 1994. Pollen representation of vegetation in Quaternary sediments: Theory and method in patchy vegetation.Journal of Ecology, 82: 881-897.

102
Swetnam T W, Allen C D, Betancourt J L, 1999. Applied historical ecology: Using the past to manage for the future.Ecological Applications, 9(4): 1189-1206.

103
Thompson L G, Davis M E, Mosley-Thompson Eet al., 1998. A 25 000-year tropical climate history from Bolivian ice cores.Science, 282: 1858-1864.

104
Trpák P, Trpáková I, 2002. Landscape function analysis based on evaluation of indicator maps and sketches of stable cadastre maps, Krajina 2002 Odpoznanik integraci, Ustinad Labem, 85-91.

105
Turner B L, Lambin E F, Reenberg A, 2007. The emergence of land change science for global environmental change and sustainability.Proceedings of the National Academy of Sciences, 104(52): 20666-20671.

106
Van Dyke E, Wasson K, 2005. Historical ecology of a central California estuary: 150 years of habitat change.Estuaries, 28(2): 173-189.

107
Veldkamp A, Lambin E F, 2001 Editorial: Predicting land-use change. Agriculture,Ecosystems and Environment, 85: 1-6.

108
Wear D N, Bolstad P V, 1998. Land-use changes in Southern Appalachian landscapes: Spatial analysis and forecast evaluation.Ecosystems, 1(6): 575-594.

109
White M A, Mladenoff D J, 1994. Old-growth forest landscape transitions from pre-European settlement to present.Landscape Ecology, 9(3): 191-205.

110
Whitney G G, 1996. From Coastal Wilderness to Fruited Plain: A History of Environmental Change in Temperate North America from 1500 to the Present. Cambridge: Cambridge University Press.

111
Williams J H, 2007. The Archeolgoy of Kent to AD 800 (Vol.8). Boydell Press, 304.

112
Wulf M, Sommer M, Schmidt R, 2010. Forest cover changes in the Prignitz region (NE Germany) between 1790 and 1960 in relation to soils and other driving forces.Landscape Ecology, 25(2): 299-313.

113
Wulf M, Rujner H, 2011. A GIS-based method for the reconstruction of the late eighteenth century forest vegetation in the Prignitz region (NE Germany).Landscape Ecology, 26(2): 153-168.

114
Ye Yu, Fang Xiuqi, Ren Yuyuet al., 2009. Arable land change in Northeast China over the past 300 years.Science in China, 39(3): 340-350. (in Chinese)

115
Yuan Yujiang, 1989. Reconstruct and forecast by the fodder grass output on the northern slope of Mount Tian tree-ring chronologies. Journal of Arid Land Resources and Environment, 3(1): 81-89.

116
Zhang Shuwen, Zhang Yangzhen, Li Ying et al., 2006. Study on the Spatial Characteristics of Land Use/Cover Change in Northeast China. Beijing: Science Press. (in Chinese)

117
Zhang Xuezhen, Wang Wei-chyung, Fang Xiuqiet al., 2011a. Vegetation of Northeast China during the late seventeenth to early twentieth century as revealed by historical documents.Regional Environmental Change, 11(4): 869-882.

118
Zhang Xuezhen, Wang Wei-chyung, Fang Xiuqiet al., 2011b. Natural vegetation pattern over Northeast China in late 17th century.Scientia Geographica Sinica, 31(2): 184-189. (in Chinese)

119
Zhu Feng, Cui Xuefeng, Miao Lijuan, 2012. China’s spatially-explicit historical land-use data and its reconstruction methodology.Progress in Geography, 31(2): 1563-1573. (in Chinese)

Outlines

/