Research Articles

Variations of bank shift rates along the Yinchuan Plain reach of the Yellow River and their influencing factors

  • WANG Suiji , 1 ,
  • LI Ling 1, 2 ,
  • CHENG Weiming 3
Expand
  • 1. Key Laboratory of Water Cycle and Related Land Surface Processes; Institute of Geographic Sciences and Natural Resources Research, CAS, Beijing 100101, China
  • 2. University of Chinese Academy of Sciences, Beijing 100049, China
  • 3. State Key Laboratory of Resources and Environmental Information System, Institute of Geographic Sciences and Natural Resources Research, CAS, Beijing 100101, China

Author: Wang Suiji, PhD and Associate Professor, specialized in fluvial geomorphology, sedimentology and land surface processes. E-mail:

Received date: 2013-12-23

  Accepted date: 2014-01-20

  Online published: 2014-04-20

Supported by

National Natural Science Foundation of China, No.41271027.National Basic Research Program of China, No.2011CB403305

Copyright

Journal of Geographical Sciences, All Rights Reserved

Abstract

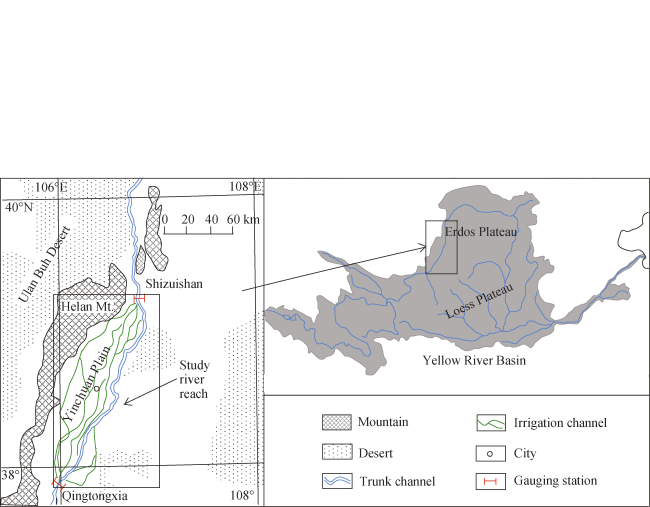
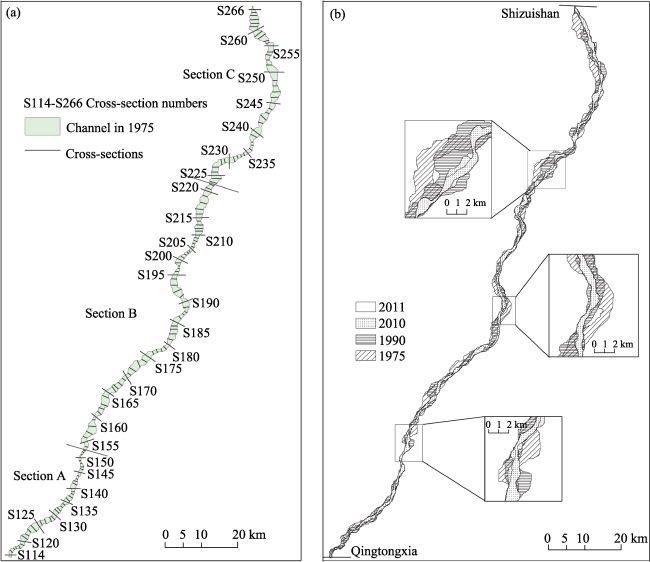
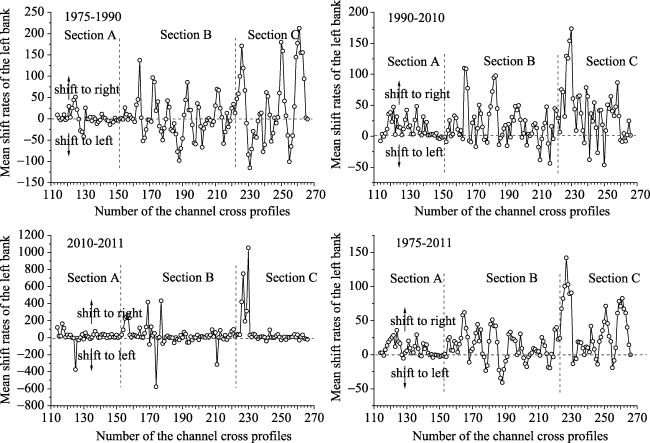
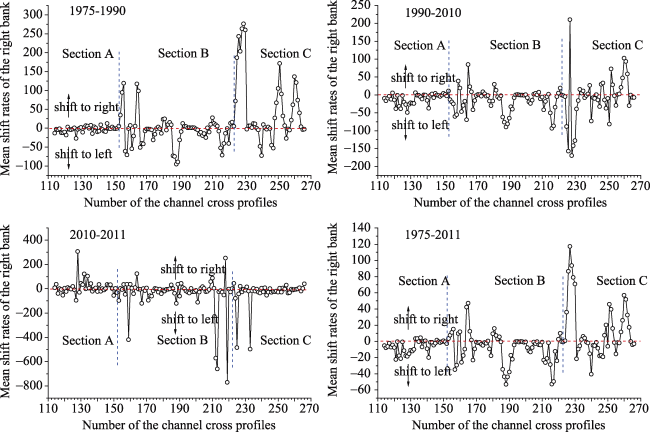
It is important to examine the lateral shift rate variation of river banks in different periods. One of the challenges in this regard is how to obtain the shift rate of river banks, as gauging stations are deficient for the study of river reaches. The present study selected the Yinchuan Plain reach of the Yellow River with a length of 196 km as a case study, and searched each point of intersection of 153 cross-sections (interval between two adjacent cross-sections was 1.3 km) and river banks in 1975, 1990, 2010 and 2011, which were plotted according to remote sensing images in those years. Then the shift rates for the points of intersection during 1975-1990, 1990-2010 and 2010-2011 were calculated, as well as the average shift rates for different sections and different periods. The results show that the left bank of the river reach shifts mostly to the right, with the average shift rates being 36.5 m/a, 27.8 m/a and 61.5 m/a in the three periods, respectively. Contemporarily, the right bank shifts mostly to the right in the first period, while it shifts to the left in the second and third periods, with the average shift rates being 31.7 m/a, 23.1 m/a and 50.8 m/a in the three periods, respectively. The average shift rates for the left and right banks during the period 1975-2011 are 22.3 m/a and 14.8 m/a, respectively. The bank shift rates for sections A, B and C are different. The shift rate ratio of the left bank in the three sections is 1:7.6:4.6 for shift to the left and 1:1.7:3.8 for shift to the right, while that of the right bank is 1:1.8:1.2 for shift to the left and 1:5.6:17.7 for shift to the right during the period 1975-2011. Obviously, the average shift rate is the least in section A, while it is maximum in section B for shift to the left and in section C for shift to the right. The temporal variation of the shift rate is influenced by human activities, while the spatial variation is controlled by the local difference in bank materials.

Cite this article

WANG Suiji , LI Ling , CHENG Weiming . Variations of bank shift rates along the Yinchuan Plain reach of the Yellow River and their influencing factors[J]. Journal of Geographical Sciences, 2014 , 24(4) : 703 -716 . DOI: 10.1007/s11442-014-1114-2

1 Introduction

The drainage area of the upper Yellow River is 386,000 km2, with a channel length of 3472 km and a channel gradient of 0.00101 (Zhao, 1996). The Maqu and Ningmeng (Ningxia and Inner Mongolia) reaches are typical alluvial channel reaches in the upper Yellow River. The Ningmeng reach has attracted more attention because of the complexity in channel evolution, sediment sources and transport, and human influences. Yang et al. (2003) regarded the source of the sediment deposited in the Inner Mongolia reach of the upper Yellow River as mainly the Ulan Buh Desert and the ten large Kongduis (the ephemeral streams in the southern part of the stem river). Shen et al. (2007) concluded that the Qingtongxia and Liujiaxia reservoirs completed in 1968 and the Longyangxia reservoir built in 1986 strongly influence the channel evolution in the river reach because they can adjust flood discharge. The Ningmeng channel has experienced processes from slight aggradation to erosion, and then to aggradation since these water conservancies were built (Zhang et al., 2002). Yao et al. (2011) estimated the change in erosion area of the river banks based on satellite images in different years and considered that the annual mean erosion area had a decreasing trend since 1958. Some researchers have paid attention to studies of the channel adjustment law based on river flow entropy (Sun, 1999) or energy dissipation rate (Sun et al., 2011). Furthermore, researchers have studied snow-melt flooding characteristics (Yang, 1992), channel pattern change (Wang, 2008), channel hydraulic geometry change (Ran et al., 2012), spatial and temporal variations of sediment filling capacity and sedimentation rate (Wang et al., 2012b), response of channel cross-sections to flood processes (Wang and Fan, 2010), channel evolutions (Fan et al., 2012), and runoff changes and their influencing factors (Wang et al., 2012a) for the Ningmeng channel reach. Some factors influencing the channel changes have been discussed broadly (Hou et al., 2007; Fan et al., 2010; Ran et al., 2010; Wang and Fan, 2010; Wang et al., 2012b). However, there have been relatively few studies on river bank shift rate for the river reach. A very important problem is how to obtain the bank shift rates for the river reach under conditions of lack of channel geometry data for the Ningmeng reach of the Yellow River (Petts, 1995).
This study takes the Yinchuan Plain reach of the upper Yellow River as an example, to calculate the channel bank shift rates during different periods according to points of intersection of the banks and 153 cross-sections, the mean interval of which is 1.3 km. The results are of great significance for understanding the channel evolution and for river management in the river reach.

2 Geographic background and methodology

2.1 Geographic background

As a part section of the Ningmeng reach of the upper Yellow River, the Yinchuan Plain reach with a channel length of 196 km is located between Qingtongxia and Shizuishan gauging stations (Figure 1). To the west of the Yinchuan Plain is the Helan Mountains, while to the east is the Erdos Plateau. Ulan Buh Desert and Hedong Sandy Land surround the Yinchuan Plain where the climate is arid and the annual precipitation is approximately 200 mm/a.
Figure 1 Location and environment of the Yinchuan Plain reach of the Yellow River
The Yellow River flows from south to north in the river reach with an average channel gradient of 0.00018 (Wang, 2012a). The channel pattern is mainly braided and locally meandering. The channel bed materials are mainly sand. Channel width ranges from 0.2 to 5.0 km and channel depth ranges from 2 to 6 m. A straight channel pattern appears in the upper part of section A (Figure 2a) where bed load changes gradually from gravel to sand. In sections B and C, the bed materials change gradually from sand to silt. Few tributaries join in the main stem in the Yinchuan Plain reach of the Yellow River. As the largest tributary in the river reach, the Kushui stream imports runoff and sediment load to the main stem, which are very small and often negligible.
Figure 2 Locations of the 153 digital channel cross-sections (a), and channel platform changes and local characteristics (b) in the Yinchuan Plain reach of the upper Yellow River

2.2 Methodology

Analyses of satellite images as important and powerful measures to obtain channel planform have been widely applied in the study of fluvial geomorphology (Khan and Islam, 2003; Kammu et al., 2008; Yang et al., 2011; Yao et al., 2011; Baki and Gan, 2012; Hossain et al., 2013). The interval between adjacent gauging stations in certain rivers is very great and often exceeds 10 km. Therefore, the bank shift characteristics between two gauging stations are not clear if one considers only the gauging data. However, comparison of fixed close digital cross-sections in different satellite images for different time intervals provides a convenient way to calculate bank shift rate. The interval of the digital cross-sections can be chosen depending on the requirements of the study. The locations of the points of intersection between the bank and the digital cross-sections are the base data for calculating the bank shift rates. The establishment of fixed digital cross-sections of small interval and comparison of the change in location of the intersection points between the banks and the digital cross-sections are an important innovation in the study of fluvial geomorphology.
The adopted satellite images for the study area were MSS with a resolution of 60 m in 1975 and TM with a resolution of 30 m in 1990, 2010 and 2011. These satellite images were obtained during flood season in those years (Table 1) and downloaded from the US Geological Survey (2012). If river flow width does not evidently change with water level, the channel boundary could be denoted and digitized using the water boundary because this boundary is clearly defined in Landsat images, as reported by Nicoll and Hickin (2010). However, this approach could not be used to digitize the broad and shallow channels, such as in the braided river reach in the upper Yellow River, because their flow width can evidently change with water level. To eliminate the influence of obvious change of river flow width in different flood seasons, we digitized the channel banks according to the vegetation boundary along the river flow. Several studies have used the limit of vegetation to denote successfully channel boundaries (e.g., Gurnell, 1997; Winterbottom, 2000; Richard et al., 2005; Yao at al., 2013). The WGS84 coordinate was adopted in this study to digitize channel boundaries and calculate data. The processes are the following. (1) Calibrate the satellite images in a relief map with a scale of 1:50,000. (2) Establish 153 fixed digital cross-sections approximately orthogonal with the river bank in the image of 1975 (Figure 2b). The numbers of these cross-sections are S114 to S266 and the interval between two adjacent cross-sections is about 1.3 km, meaning the density of the cross-sections is very high. These cross-sections are vectors and their locations are fixed for different year’s images. (3) Use ArcGIS software to draw the channel planform in the different years and the bank line as a vector (Figure 2a). (4) Use FME software to select the data of the left and right bank lines and the data of the intersection points of the cross-sections with bank lines.
Table 1 Daily discharge on the date of obtaining remote sensing images, the largest discharge in the year and the relative error in calculating channel banks
Date of the satellite images Daily discharge (m3/s) Maximum discharge in the year (m3/s) Resolution of the images (m) Average channel width (m) Relative
error (%)
1975-09-15 2580 2740 60 1354 8.86
1990-08-30 944 1410 30 1386 4.33
2010-08-18 905 1520 30 749 8.01
2011-06-18 1134 1990 30 688 8.72
The dates of the remote sensing images, the daily discharge and the maximum daily discharge in the year are listed in Table 1. To digitize the channel banks using the vegetation boundary along the river, the precision is decided by the image resolutions, which mainly influence the drawing precision for the banks but do not influence the channel width far from a resolution distance between the banks. Therefore, possible errors in digitizing the channel boundary are twice the resolution and are listed in Table 1. There are no new errors in calculating the shift velocities of channel banks.

3 Results

The channel bank shift extents and channel bank shift rates of the study river reach in four different periods are revealed according to the changes of the intersection points. Positive and negative values of the bank shift extents and rates show the direction of bank shift to the left and to the right along each cross-section, respectively. In a certain river reach, the channel bank shifts commonly show two different directions along the cross-sections: to the left in a short channel section (these shift rates are labeled as negative) or to the right in adjacent short channel section (these shift rates are labeled as positive). It is inappropriate to calculate the mean shift rate in a river reach as the sum of all shift rates divided simply by the numbers of cross-sections. The correct way to calculate the mean shift rate is just to sum the mean positive rate (sum of all positive rates divided by the total positive and negative numbers) and absolute value of the mean negative rate (sum of all negative rates divided by the total positive and negative numbers); also, it is wrong to sum the mean positive and negative rates first, because the positive and negative shift rates partly counteract. The total study river reach was divided into three sections moving downstream: A (from S114 to s153), B (from S154 to s223) and C (from S224 to s166) (Figure 2a). The least average rate of bank shift is in section A, the intermediate rate is in section B and the greatest rate is in section C.

3.1 Shift extents of the channel banks

3.1.1 Maximum shift extents
The maximum shift extents of the channel banks in the study river reach in each of the periods are listed in Table 2. Here, we take the period 1975-2011 as an example to discuss the changes in maximum shift extent. In section A, the maximum shift extents of the left bank are 191.4 m and 1286.7 m, respectively, for shifts to the left and right, while the maximum shift extents of the right bank are 806.3 m and 160.3 m, respectively, for shifts to the left and right. In section B, the values are 1476.9 m and 2225.8 m, respectively, for shifts to the left and right for the left bank and 1915.6 m and 1691.5 m, respectively, for shifts to the left and right for the right bank. In section C, the values are 700.8 m and 5114.7 m, respectively, for shifts to the left and right for the left bank and 1462.5 m and 4218.7 m, respectively, for shifts to the left and right for the right bank. For both left and right banks, the maximum shift to the right is always greater than that to the left; furthermore, it shows an increasing trend along the sections A, B and C.
Table 2 Maximum shift extent of channel banks in the three reaches for various periods (m)
Reach Location 1975-1990 1990-2010 2010-2011 1975-2011
Section A Left bank -627.8 -152.1 -375.8 -191.4
763.5 961.1 162.6 1286.7
Right bank -411.6 -982.4 -97.4 -806.3
185.1 216.7 306.1 160.3
Section B Left bank -1476.2 -1873.9 -577.3 -1476.9
2059.3 1694.0 431.0 2225.8
Right bank -1427.3 -1881.5 -771.8 -1915.6
1780.0 1069.0 251.0 1691.5
Section C Left bank -1733.5 -930.8 -42.9 -700.8
3182.9 3467.7 1051.6 5114.7
Right bank -1087.8 -3398.7 -498.8 -1462.5
4143.7 4198.8 40.5 4218.7
3.1.2 Average shift extents
The average shift extents of the channel banks in the study river reach in each of the periods are listed in Table 3. We take the period 1975-2011 as an example to discuss the changes of the average shift extents. In section A and for the left bank, the average shift extent to the left is 63.0 m for 13 intersection points (between channel cross-sections and the river bank) and to the right is 451.4 m for 27 intersection points, while for the right bank, the values are 285.2 m for 32 intersection points shifted to the left and 78.5 m for 8 intersection points shifted to the right. In section B and for the left bank, the average shift extent is 491.8 m for 20 intersection points shifted to the left and 784.0 m for 50 intersection points shifted to the right, while for the right bank, the values are 511.3 m for 53 intersection points shifted to the left and 446.8 m for 17 intersection points shifted to the right. In section C and for the left bank, the average shift extent is 298.7 m for 9 intersection points shifted to the left and 1703.2 m for 34 intersection points shifted to the right, while for the right bank, the values are 336.3 m for 22 intersection points shifted to the left and 1404.9 m for 21 intersection points shifted to the right. The maximum average shift extent to the left and right is in sections B and C, respectively. As a whole, the left bank mainly shifts to the right in all three sections, and the right bank mainly shifts to the left in sections A and B. This shows a shrinking channel and gradual migration to the right in the study river reach.

3.2 Shift rates of the left bank and their spatial change trends

Figure 3 shows the downstream change of the shift rates of the left bank in the Yinchuan lain reach of the upper Yellow River for the different periods. The maximum and minimum shift rates of the left bank are in sections C and A, respectively. The details of the mean shift rates for all the 153 cross-sections or for different sections in the periods are discussed below.
Table 3 Average shift extent of channel banks in the three reaches for various periods (m)
Reach Location 1975-1990 1990-2010 2010-2011 1975-2011
Mean Number Mean Number Mean Number Mean Number
Section A Left bank -134.4 20 -58.8 7 -46.5 10 -63.0 13
183.5 20 310.4 33 33.9 30 451.4 27
Right bank -102.6 27 -283.3 33 -29.7 18 -285.2 32
71.5 13 98.5 7 39.7 22 78.5 8
Section B Left bank -416.5 38 -197.8 20 -68.0 21 -491.8 20
535.6 32 607.0 50 63.0 49 784.0 50
Right bank -424.3 40 -538.9 51 -81.1 46 -511.3 53
343.5 30 283.3 19 34.9 24 446.8 17
Section C Left bank -737.8 18 -415.2 7 -16.0 12 -298.7 9
1248.7 25 1032.1 36 104.1 31 1703.2 34
Right bank -291.0 14 -723.9 25 -53.6 31 -336.3 22
1298.6 29 606.9 18 11.5 12 1404.9 21
Total reach Left bank -418.3 76 -224.0 34 -48.5 43 -317.7 42
675.7 77 649.9 119 66.6 110 984.6 111
Right bank -294.0 81 -515.4 109 -62.4 95 -407.7 107
679.1 72 329.5 44 31.9 58 820.1 46
During the period 1975-1990, the mean shift rate of the left bank is 27.9 m/a for 76 intersection points shifted to the left and 45.0 m/a for 77 intersection points shifted to the right (Figure 3 and Table 4). The mean shift rates for all the 153 cross-sections are 13.9 m/a and 22.6 m/a shifted to the left and right, respectively. Therefore, the total mean shift rate of the left bank is 36.5 m/a during the period 1975-1990. The ratios of the mean shift rates for sections A, B and C are 1:3.1:5.5 and 1:2.9:6.8 for shifts to the left and right, respectively. Obviously, the mean shift rate shows an increasing trend along the three sections.
Figure 3 Downstream variation of the shift rates of the left bank in the Yinchuan Plain reach of the Yellow River in the different periods (m/a)
During the period 1990-2010, the mean shift rate of the left bank is 11.2 m/a for 34 intersection points shifted to the left and 32.5 m/a for 119 intersection points shifted to the right (Figure 3 and Table 4). The mean shift rates of all the 153 cross-sections are 2.5 m/a and 25.3 m/a shifted to the left and right, respectively. Therefore, the total mean shift rate of the left bank is 27.8 m/a during the period 1990-2010. The ratios of the mean shift rates for sections A, B and C are 1:3.4:7.2 and 1:2.0:3.3 for shifts to the left and right, respectively. In this period, the mean shift rate also shows an increasing trend along the three sections.
Table 4 Shift rate of the left bank in the three reaches for various periods (m/a)
Reach 1975-1990 1990-2010 2010-2011 1975-2011
Rate Number Rate Number Rate Number Rate Number
Section A -9.0 20 -2.9 7 -46.5 10 -1.8 13
12.3 20 15.5 33 33.9 30 12.5 27
Section B -27.8 38 -9.9 20 -68.0 21 -13.7 20
35.7 32 30.4 50 63.0 49 21.8 50
Section C -49.2 18 -20.8 7 -16.0 12 -8.3 9
83.3 25 51.6 36 104.1 31 47.3 34
Mean -27.9 76 -11.2 34 -48.5 43 -8.8 42
45.0 77 32.5 119 66.6 110 27.4 111
Mean in one direction -13.9 153 -2.5 153 -13.6 153 -2.4 153
22.6 153 25.3 153 47.9 153 19.9 153
Mean in two
directions
36.5 153 27.8 153 61.5 153 22.3 153
During the period 2010-2011, the mean shift rate of the left bank is 48.5 m/a for 43 intersection points shifted to the left and 66.6 m/a for 110 intersection points shifted to the right (Figure 3 and Table 4). The mean shift rates for all the 153 cross-sections are 13.6 m/a and 47.9 m/a for shifts to the left and right, respectively. Consequently, the total mean shift rate of the left bank is 61.5 m/a during the period 2010-2011. In this annual period, the left bank still shifts rapidly to the right. The ratio of the mean shift rates to the left for sections A, B and C is 1:1.5:0.3; the maximum is in section B, while the ratio of the mean shift rates to the right for the three sections is 1:1.9:3.1, showing a downstream increasing trend.
In the 36 years of the period 1975-2011, the mean shift rate of the left bank is 8.8 m/a for 42 intersection points shifted to the left and 27.4 m/a for 111 intersection points shifted to the right (Figure 3 and Table 4). The mean shift rates for all the 153 cross-sections are 2.4 m/a and 19.9 m/a for shifts to the left and right, respectively. Accordingly, the total mean shift rate of the left bank is 22.3 m/a during the period 1975-2011. Obviously, the left bank shifts mainly to the right in this period. The ratios of the mean shift rates for sections A, B and C are 1:7.6:4.6 and 1:1.7:3.8 for shifts to the left and right, respectively. The maximum of the mean shift rate is in section B for shift to the left, while it is in section C for shift to the right.

3.3 Shift rates of the right bank and their spatial changing trends

Figure 4 shows the downstream change of the shift rates of the right bank in the Yinchuan Plain reach of the upper Yellow River for the different periods. The maximum and minimum shift rates of the right bank are in sections C and A, respectively. The details of the mean shift rates for all the 153 cross-sections or for the different sections in the periods are discussed below.
Figure 4 Downstream variation of the shift rates of the right bank in the Yinchuan Plain reach of the Yellow River in different periods (m/a)
In the period 1975-1990, the mean shift rate of the right bank is 19.6 m/a for 81 intersection points shifted to the left and 45.3 m/a for 72 intersection points shifted to the right (Figure 4 and Table 5). The mean shift rates for all the 153 cross-sections are 10.4 m/a and 21.3 m/a for shifts to the left and right, respectively. Therefore, the total mean shift rate of the right bank is 31.7 m/a during the period 1975-1990. The ratios of the mean shift rates for sections A, B and C are 1:4.2:2.9 and 1:4.8:18.0 for shifts to the left and right, respectively. The maximum mean shift rate for shift to the left is in section B, while the mean shift rates for shifts to the right show an increasing trend along the three sections. The increases are 5 and 17 times in sections B and C, respectively, compared to section A.
Table 5 Shift rate of the right bank in the three reaches for various periods (m/a)
Reach 1975-1990 1990-2010 2010-2011 1975-2011
Rate Number Rate Number Rate Number Rate Number
Section A -6.8 27 -14.2 33 -29.7 18 -7.9 32
4.8 13 4.9 7 39.7 22 2.2 8
Section B -28.3 40 -27.0 51 -81.1 46 -14.2 53
22.9 30 14.2 19 34.9 24 12.4 17
Section C -19.4 14 -36.2 25 -53.6 31 -9.3 22
86.6 29 30.4 18 11.5 12 39.0 21
Total reach -19.6 81 -25.8 109 -62.4 95 -11.3 107
45.3 72 16.5 44 31.9 58 22.8 46
Mean in reach -10.4 153 -18.4 153 -38.7 153 -7.9 153
21.3 153 4.7 153 12.1 153 6.9 153
Total mean 31.7 153 23.1 153 50.8 153 14.8 153
In the period 1990-2010, the mean shift rate of the right bank is 25.8 m/a for 109 intersection points shifted to the left and 16.5 m/a for 44 intersection points shifted to the right (Figure 4 and Table 5). The mean shift rates for all the 153 cross-sections are 18.4 m/a and 4.7 m/a for shifts to the left and right, respectively. Consequently, the total mean shift rate of the right bank during the period is 23.1 m/a. The ratios of the shift rates for sections A, B and C are 1:1.9:2.5 and 1:2.9:6.2 for shifts to the left and right, respectively, and both show an increasing trend along the sections.
In the period 2010-2011, the mean shift rate is 62.4 m/a for 95 intersection points shifted to the left and 31.9 m/a for 58 intersection points shifted to the right (Figure 4 and Table 5). The mean shift rate for all the 153 cross-sections is 38.7 m/a shifting to the left and 12.1 m/a shifting to the right. Accordingly, the total mean shift rate of the right bank during the period is 50.8 m/a. The ratio of the mean shift rates for shift to the left along sections A, B and C is 1:2.7:1.8, which means the maximum is in section B and the minimum is in section A, while that for shift to the right is 1:0.9:0.3, which shows a decreasing trend along the sections.
In the entire period 1975-2011, there are 107 intersection points on the right bank shifted to the left and their mean shift rate is 11.3 m/a, while there are 46 points shifted to the right and their mean shift rate is 22.8 m/a (Figure 4 and Table 5). The mean shift rate for all the 153 intersection points is 7.9 m/a for shift to the left and 6.9 m/a for shift to the right. Therefore, the total mean shift rate of the right bank in the period is 14.8 m/a. The ratio of the mean shift rates for shift to the left along sections A, B and C is 1:1.8:1.2, which indicates that the maximum is in section B and the minimum is in section A, while that for shift to the right is 1:5.6:17.7, showing an increasing trend along the sections.

4 Discussion

Channel bank shift rate can reflect the lateral mobility of a channel and is an important aspect in the study of river evolution. River evolution is a necessary phenomenon of channel change resulting from the interaction between flow with suspended sediment and the channel boundary. Here, the flow is a hydraulic factor, which plays a crucial role in river channel evolution, while the materials and their structure in the channel bed and banks play a secondary role because the cohesive ability of the channel bank materials also influences the channel change. It is common to observe very dissimilar changes of river channels with similar hydraulic conditions.
As mentioned above, the channel bank shift rates of the Yinchuan Plain reach in the upper Yellow River show obvious differences in different periods and different channel sections. The bank shift differences in different periods are mainly caused by the discharge variations, especially for flood reasons and the span of the periods used to compare the changes of channel planforms. Since the upriver Qingtongxia, Liujiaxia and Longyangxia reservoirs were built in 1964, 1968 and 1986, respectively, the discharge in the Yinchuan Plain reach of the Yellow River in flood seasons has decreased evidently because of large water interception by the reservoirs in the seasons (Figure 5). The annual mean discharge of 3105.8 m3/s in the period 1975-1986 decreased evidently to 2136.7 m3/s in the period 1987-1990, and the maximum daily discharge has decreased markedly since 1990 (Figure 5). This has led to the decrease of the bank discharge in flood seasons. Consequently, inevitable channel shrinkage of about 4.8 m/a has occurred in the study river reach since 1975. Furthermore, the channel shifted to the right at about 31.7 m/a as a whole in the period because the left channel bank had more cohesive materials than the right.
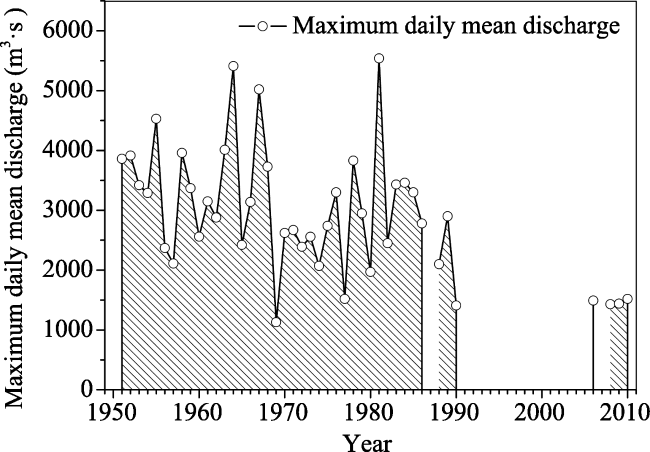
Figure 5 Maximum daily mean discharge at Qingtongxia Station
The maximum daily discharge at Qingtongxia Station (Figure 2) is 1410 m3/s in 1990 and 1520 m3/s in 2010 (Figure 5). These values are very close. Furthermore, the mean discharges on August 30 in 1990 and August 18 in 2010 are 944 m3/s and 905 m3/s (Table 1), respectively, which are also very close. The mean annual channel shrinkage is 4.7 m/a with a channel rightward migration of 23.1 m/a in the period 1990-2010. In the short period 2010-2011, the channel shrinkage is 10.7 m/a with a channel rightward migration of 50.8 m/a (Table 5). In the abovementioned three periods, the channel of the Yinchuan Plain reach of the upper Yellow River shifted evidently to the right. This reflects the better ability to resist erosion of the left bank than of the right bank. In addition, the shift rates in the yearly time period are usually greater than in a longer time period for the Yinchuan Plain reach where the materials of the banks are mainly composed of silts. One reason could be that the bank shifted to and fro commonly in a long time scale, and thus the calculated mean shift rates are less than that for a yearly time scale. In this paper, the shift rates for the yearly time scale and for the decennary time scale could corroborate the abovementioned viewpoint.
The main factors having an influence on the difference of channel bank shift rates in the different sections are the various material sizes along the banks and the alluvial plain. However, the discharge variation is a secondary factor because the discharges on the dates pertaining to the channel planforms in the study river reach are almost equal, with the exception of September 15, 1975 (Table 1). As reported by Hudson and Kesel (2000), the shift rate of the channel bend of the upper Mississippi River was 45.2 m/a in 1877-1924 because there are many clay plugs in the alluvial plain about the river reach, while the value increased to 59.1 m/a in the lower river reach in the same period because there are few clay plugs. Obviously, the cohesive clay plugs can impede channel bank shift. For the river reach of the present study, section A is located in the upper Yinchuan Plain reach where the sediments are coarse. The bed materials change from fine gravel to coarse sand along the channel, and the bank materials are also coarse and not prone to erosion. In addition, the greater channel gradient is not favorable for erosion of channel banks. These factors result in the least mean shift rates occurring in section A. The bank materials in section B are mainly composed of middle and fine sand in the understratum and clay and mud in the superstratum. River flow can erode preferentially the understratum and thus the cohesive superstratum can collapse to the river bed. This erosion mode could induce the evident bank shift and greater shift rate in section B. Here, however, the shift rate of the right bank in the leftward direction is a maximum in section B compared with the other two sections. This means lateral accretion of the right bank is a dominant process for section B in the whole period. The materials of both banks and bed in section C located in the lower part of the Yinchuan Plain reach are finer than in section B. Here, the superstratum materials in bank columnar section are composed of clay and mud, while the understratum is composed of fine sand and silt. The fine sand and silt in section C are more prone to erosion than the medium to fine sand in section B. This is the fundamental cause of the maximum shift rates occurring in section C. The potential relationships between the sediment granularity parameters of the bank materials and the channel bank shift rates in the Yinchuan Plain reach of the upper Yellow River may be an important aspect for future study.

5 Conclusions

According to the above discussion, the main conclusions that can be drawn are as follows.
(1) During the three periods 1975-1990, 1990-2010 and 2010-2011 and for all the 153 cross-sections, the numbers of channel left bank shifts to the left are 76, 34 and 43, and the mean shift rates are -27.9 m/a, -11.2 m/a and -48.5 m/a, respectively, in the three periods. The numbers of channel left bank shifts to the right are 77, 119 and 110, and the mean shift rates are 45.0 m/a, 32.5 m/a and 66.6 m/a, respectively, in the three periods. The numbers of channel right bank shifts to the left are 81, 109 and 95, and the mean shift rates are -19.6 m/a, -25.8 m/a and -62.4 m/a, respectively, in the three periods. The numbers of channel right bank shifts to the right are 72, 44 and 58, and the mean shift rates are 45.3 m/a, 16.5 m/a and 31.9 m/a, respectively, in the three periods.
(2) The weighted average indicates that the left and right banks in the study river reach generally shift to the right. For the whole Yinchuan Plain reach, the mean shift rates of the left bank shifting to the right are 36.5 m/a, 27.8 m/a and 61.5 m/a, and those of the right bank shifting to the right are 31.7 m/a, 23.1 m/a and 50.85 m/a; at the same time, the channel shrinkage rates are 4.8 m, 4.7 m and 10.7 m, respectively, in the periods 1975-1990, 1990-2010 and 2010-2011. The greater bank shift rates in the yearly period 2010-2011 show that they are influenced inevitably by the to-and-fro shifts of banks in longer periods to calculate the channel bank shift rates.
(3) The channel bank shift rates show evident spatial variation trends. Along sections A, B and C and in the interval from 1975 to 2011, the ratios of the mean shift rates of the left bank for a shift to the left and right are 1:7.6:4.6 and 1:1.7:3.8, respectively, while those of the right bank for a shift to the left and right are 1:1.8:1.2 and 1:5.6:17.7, respectively. Obviously, for both left and right banks, the minimum shift rate is in section A, while the maximum is in section B for a shift to the left and in section C for a shift to the right. The controlling factors are mainly the spatial change of the size of material of left and right banks, and the spatial change of the thickness of clay and mud sediment in bank superstratum. The potential relationships between bank shift rates and bank material sizes will be an important aspect of future study.

The authors have declared that no competing interests exist.

1
Baki A B M, Gan T Y, 2012. Riverbank migration and island dynamics of the braided Jamuna River of the Ganges Brahmaputra basin using multi-temporal Landsat images.Quaternary International, 263: 146-161.

2
Fan X, Shi C, Zhou Yet al., 2012. Characteristics of flood regime in Ningxia-Inner Mongolia Reaches of the upper Yellow River. Resources Science, 34(1): 65-73.

3
Fan X, Wang S, Ran L, 2010. Analysis of the channel evolution and influence factors in Ningxia Reach of the Yellow River.Journal of Water Resources and Water Engineering, 21(1): 5-11. (in Chinese)

4
Gurnell A M, 1997. Channel change on the River Dee meanders, 1946-1992, from the analysis of air photographs.Regulated Rivers: Research and Management, 13: 13-26.

5
Hossain M A, Gan T Y, Baki A B M, 2013. Assessing morphological changes of the Ganges River using satellite images.Quaternary International, 304: 142-155.

6
Hou S, Chang W, Wang Pet al., 2007. Channel shrinking characteristics and cause of formation in the Neimenggu Reach of the Yellow River.Yellow River, 29(1): 24-26. (in Chinese)

7
Hudson P F, Kesel R H, 2000. Channel migration and meander-bend curvature in the lower Mississippi River prior to major human modification.Geology, 28(6): 531-534.

8
Kammu M, Lu X X, Rasphone Aet al., 2008. Riverbank changes along the Mekong River: Remote sensing detection in the Vientiane-Nong Khai area.Quaternary International, 186: 100-112.

9
Khan N I, Islam A, 2003. Quantification of erosion patterns in the Brahmaputra-Jamuna River using geographical information system and remote sensing techniques.Hydrological Processes, 17: 959-966.

10
Nicoll T J, Hickin E J, 2010. Planform geometry and channel migration of confined meandering rivers on the Canadian prairies.Geomorphology, 116: 37-47.

11
Petts G E, 1995. Changing river channels: The geographical tradition. In: Gurnell A, Petts G (eds.). Changing River Channels. New York: John Wiley & Sons, 1-23.

12
Ran L, Wang S, Fan X, 2010. Channel change at Toudaoguai Station and its responses to the operation of upstream reservoirs in the upper Yellow River. Journal of Geographical Sciences, 20(2): 231-247.

13
Ran L, Wang S, Lu X, 2012. Hydraulic geometry change of a large river: A case study of the upper Yellow River.Environmental Earth Sciences, 66: 1247-1257.

14
Richard G A, Julien P Y, Baird D C, 2005. Statistical analysis of lateral migration of the Rio Grande, New Mexico.Geomorphology, 71: 139-155.

15
Shen G, Zhang Y, Hou Set al., 2007. Impact of water and sediment regulation by reservoirs in the upper Yellow River on Inner-Mongolia reaches.Journal of Sediment Research, (1): 67-75. (in Chinese)

16
Sun D, 1999. Analysis on energy distribution-dissipation relation on river system.Journal of Hydraulic Engineering, (3): 49-53. (in Chinese)

17
Sun D, Yang Z, Zhang Let al., 2011. Analysis of riverbed form adjustment based on energy dissipation in the Inner Mongolia Reach of Yellow River.Advances in Water Science, 22(5): 653-661. (in Chinese)

18
US Geological Survey,

19
Wang S, 2008. Analysis of river pattern transformations in the Yellow River basin.Progress in Geography, 27(2): 10-17. (in Chinese)

20
Wang S, 2012. Variations of the channel sedimentation rate in the Yinchuan Plain reach of the Yellow River.Acta Seidmentologica Sinica, 30(3): 565-571. (in Chinese)

21
Wang S, Fan X, 2010. Flood processes and channel responses in typical years of the different channel patterns in Neimenggu reaches of the upper Yellow River.Progress in Geography, 29(4): 501-506. (in Chinese)

22
Wang S, Yan M, Yan Yet al., 2012a. Contributions of climate change and human activities to the changes in runoff increment in different sections of the Yellow River.Quaternary International, 282: 66-77.

23
Wang S, Yan Y, Li Y, 2012b. Spatial and temporal variations of suspended sediment deposition in the alluvial reach of the upper Yellow River from 1952 to 2007. Catena, 92: 30-37.

24
Winterbottom S, 2000. Medium and short-term channel planform changes of the Rivers Tay and Tummel, Scotland.Geomorphology, 34: 195-208.

25
Yang G, Ta W, Dai Fet al., 2003. Contribution of sand sources to the silting of riverbed in Inner Mongolia section of Huanghe River. Journal of Desert Research, 23(2): 152-159. (in Chinese)

26
Yang L, 1992. Analysis on ice flood discharge in Ningmeng reach of the Yellow River.Journal of Sediment Research, 6: 62-68. (in Chinese)

27
Yang S, Li M, Liu Tet al., 2011. A method of alluvial fan automatic extraction from TM image.Remote Sensing for Land & Resources, (2): 65-69. (in Chinese)

28
Yao Z, Ta W, Jia Xet al., 2011. Bank erosion and accretion along the Ningxia-Inner Mongolia reaches of the Yellow River from 1958 to 2008.Geomorphology, 127: 99-106.

29
Yao Z, Xiao J, Ta W et al., 2013. Planform channel dynamics along the Ningxia-Inner Mongolia reaches of the Yellow River from 1958 to 2008: Analysis using Landsat images and topographic maps.Environ. Earth Sci., 2013, 70: 97-106.

30
Zhang X, Pei M, Pan Xet al., 2002. Adjustment of alluvial reach in the Yellow River.Journal of Sediment Research, (3): 1-8. (in Chinese)

31
Zhao W, 1996. The Sediments in the Yellow River. Zhengzhou: Yellow River Water Conservancy Press. (in Chinese)

Outlines

/