Research Articles

Spatial-temporal characteristics of lake area variations in Hoh Xil region from 1970 to 2011

  • YAO Xiaojun , 1, 2 ,
  • LIU Shiyin 2 ,
  • LI Long 1 ,
  • SUN Meiping 1 ,
  • LUO Jing 1
Expand
  • 1. College of Geography and Environment Sciences, Northwest Normal University, Lanzhou 730070, China
  • 2. State Key Laboratory of Cryosphere Sciences, Cold and Arid Regions Environmental and Engineering Research Institute, CAS, Lanzhou 730000, China

Author: Yao Xiaojun (1980-), PhD Candidate, specialized in the research of GIS and lake evolution. E-mail:

Received date: 2013-07-22

  Accepted date: 2013-08-29

  Online published: 2014-04-20

Supported by

National Science-technology Support Plan Project, No.2012BAC19B07.National Natural Science Foundation of China, No.41071044.No.41261016.No.41190084.Youth Teacher Scientific Capability Promoting Project of Northwest Normal Un.NWNU-LKQN-10-35

Copyright

Journal of Geographical Sciences, All Rights Reserved

Abstract

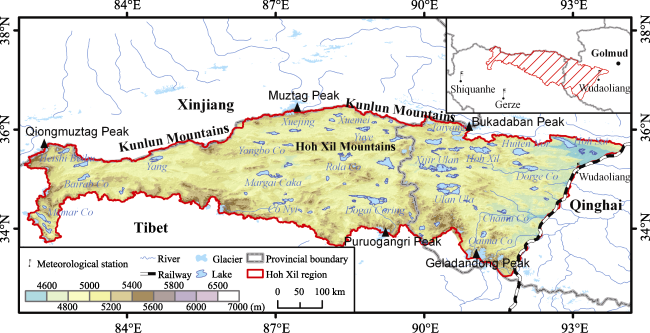
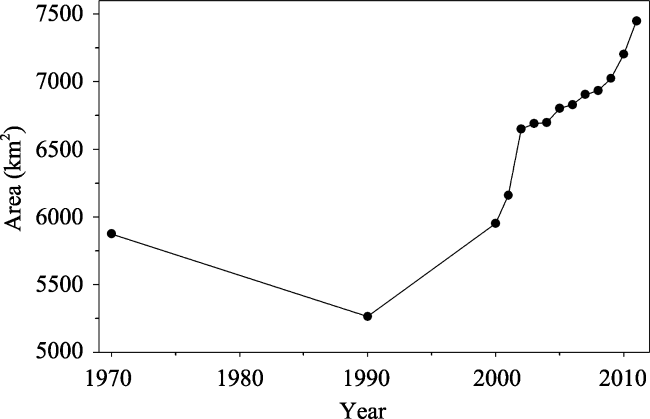
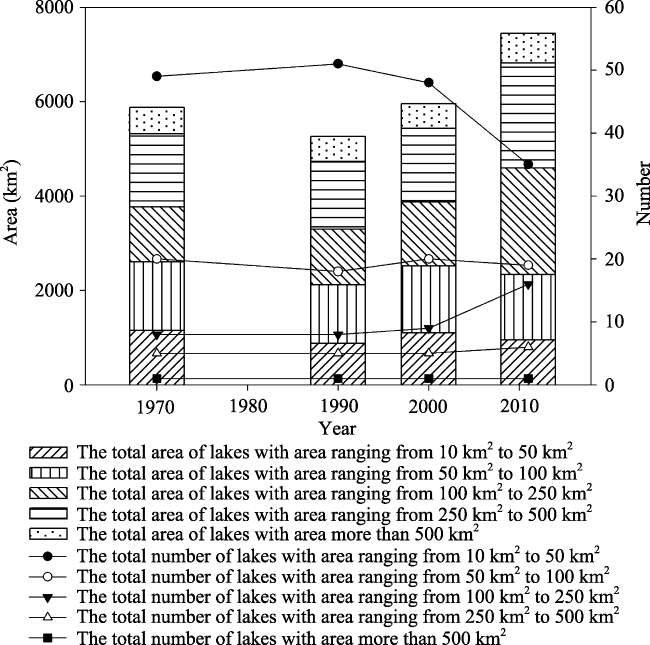
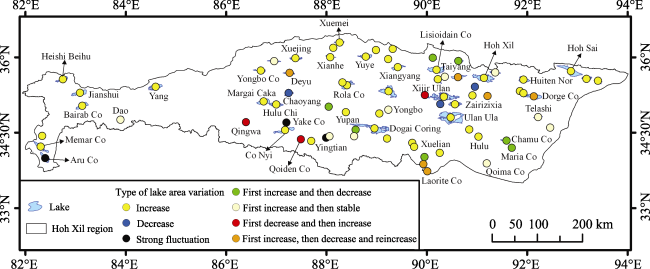
As one of the areas with numerous lakes on the Tibetan Plateau, the Hoh Xil region plays an extremely important role in the fragile plateau eco-environment. Based on topographic maps in the 1970s and Landsat TM/ETM+ remote sensing images in the 1990s and the period from 2000 to 2011, the data of 83 lakes with an area above 10 km2 each were obtained by digitization method and artificial visual interpretation technology, and the causes for lake variations were also analyzed. Some conclusions can be drawn as follows. (1) From the 1970s to 2011, the lakes in the Hoh Xil region firstly shrank and then expanded. In particular, the area of lakes generally decreased during the 1970s-1990s. Then the lakes expanded from the 1990s to 2000 and the area was slightly higher than that in the 1970s. The area of lakes dramatically increased after 2000. (2) From 2000 to 2011, the lakes with different area ranks in the Hoh Xil region showed an overall expansion trend. Meanwhile, some regional differences were also discovered. Most of the lakes expanded and were widely distributed in the northern, central and western parts of the region. Some lakes were merged together or overflowed due to their rapid expansion. A small number of lakes with the trend of area decrease or strong fluctuation were scattered in the central and southern parts of the study area. And their variations were related to their own supply conditions or hydraulic connection with the downstream lakes or rivers. (3) The increase in precipitation was the dominant factor resulting in the expansion of lakes in the Hoh Xil region. The secondary factor was the increase in meltwater from glaciers and frozen soil due to climate warming.

Cite this article

YAO Xiaojun , LIU Shiyin , LI Long , SUN Meiping , LUO Jing . Spatial-temporal characteristics of lake area variations in Hoh Xil region from 1970 to 2011[J]. Journal of Geographical Sciences, 2014 , 24(4) : 689 -702 . DOI: 10.1007/s11442-014-1113-3

1 Introduction

As lakes are the important components of terrestrial hydrosphere, their area changes are the comprehensive result of water volume balance in the watershed and can factually record the information of climate change and human activity in lake area at different temporal scales. Thus, lakes are considered as an essential indicator which can reveal the global or regional climate change (Ding et al., 2006). Tibetan Plateau Lake region, the largest lake region with the highest altitude and the largest number of lakes in the world, contains 1055 lakes with an area above 1.0 km2 each and total area of 41,831.7 km2, which respectively account for 39.2% of the total lakes and 51.4% of the total lake area in China (Ma et al., 2011). Due to severe natural conditions, remoteness, inconvenient traffic and other factors, the majority of the lakes on the Tibetan Plateau are less disturbed by human activities. Thus the changes of the lakes on the Tibetan Plateau can primarily reflect the influence of natural factors.
Under the background of global climate warming, the climate and environment in the Tibetan Plateau had been significantly changed in the past 50 years. In particular, the temperature showed an obvious rising trend, and the trend was becoming more significant in the recent years (Song et al., 2012). The variation of precipitation had a difference in space, but there was a humidification trend in the majority of the Tibetan Plateau (Jiang et al., 2012). And glaciers had been retreating and thinning so that the meltwater outpouring from the glaciers stocking the winter snowfalls and rainfalls increased (Yao et al., 2012a). Meanwhile, the lakes on the Tibetan Plateau also experienced the significant changes (Li, 2012). With the geographical information technologies including RS (Remote Sensing) and GIS (Geographical Information System), Li et al. (2011) studied the changes of lakes on the Tibetan Plateau and found that they showed an expansion trend as a whole. From the 1970s to 2009, the total area of the lakes on the Tibetan Plateau was increased by 27.3%. Furthermore, the change of lakes was characterized by significant regional difference. The lakes on the Qiangtang Plateau firstly shrank and then expanded. Siling Co Lake and its surrounding lakes continuously spread. However, the lakes at northern foothills of the Gangdise Mountain were in a relatively stable state in the past 30 years (Shao et al., 2007; Li et al., 2011). In addition, the changes of some lakes on the Tibetan Plateau were also paid attentions by the scholars and local government, including the lakes in the central Tibetan Plateau (Lei et al., 2013), Nagqu region (Bian et al., 2006), Qiangtang region (Wan et al., 2010), Bangkog Co Lake (Zhao et al., 2006), Nam Co Lake (Zhang et al., 2011), Siling Co Lake (Bian et al., 2010), Yamzho Yumco Lake (Chu et al., 2012b), Mapam Yumco Lake (La et al., 2012), etc. In recent years, the inventory of glacial lakes and their change have been studied in some regions, such as the Himalayas (Wang et al., 2010), Boshula Mountain (Wang et al., 2011), Lhozhag region (Li et al., 2011) and Rawok Lake region (Xin et al., 2009). These studies not only provided people a broader knowledge of lake change on the Tibetan Plateau, but also gave a valuable reference for water resource utilization and disaster prevention in this region.
The Hoh Xil region is one of the concentrated distribution areas with lakes on the Tibetan Plateau. These lakes in the Hoh Xil region are the destinations of precipitation, snowmelt and spring as well as the gathering places of weathered soluble substances and saline minerals. For the local wildlife, these lakes also provide the stable water source and the essential inorganic nutrients. Therefore, the above functions of the lakes are extremely important to maintain the fragile ecological environment on the Tibetan Plateau (Hu, 1994). In September 2011, water spillover in Huiten Nor Lake in the hinterland of the Hoh Xil Nature Reserve led to the quick expansion of the downstream lakes including Hoh Sai Lake, Haiding Lake and Yan Lake (Yao et al., 2012b). Subsequently, a controversy was evoked on the issue whether Kusai River would become the northern source of the Yangtze River, as well as the way that the widening waterway would affect the migration of Tibetan antelope. In this paper, based on numerous topographical maps and remote sensing imageries, the areas of the main lakes in different periods in the Hoh Xil region were obtained with RS and GIS techniques. Then the characteristics and causes of lake area variation in the past 40 years were systematically analyzed.

2 Study area

The Hoh Xil region (33°30′-36°29′N and 81°56'-94°06'E) is located in the hinterland of the Tibetan Plateau (Figure 1) with an area of about 23.5×10⁴ km2, including part of Golmud in Qinghai Province and parts of Zhiduo, Bangkog, Nima and Gerze in Tibet Autonomous Region (TAR). The Hoh Xil region is geographically composed of Hoh Xil Mountain and the surrounding highland and lake basins. And its northern and southern edges belong to the Kunlun Mountains and the Ulan Ula Mountain, respectively. The altitude as a whole is relatively low and flat in the central area, and high in the west and low in the east in the Hoh Xil region. And the average altitude is above 4600 m so that modern glaciers develop in the altitude above 5500-6000 m (Shi, 2005). The climate in this region is characterized by low temperature and less precipitation which is gradually decreased from southeast to northwest. The natural landscapes are subrogated from alpine meadow, alpine steppe to alpine desert (Hu, 1992). Although there are less species, the local special species of the Tibetan Plateau account for a large proportion with large population (George et al., 2007).
Figure 1 Location of the Hoh Xil region
In the view of large-scale watershed, the Hoh Xil region is in the intersection zone of Qiangtang Inland Lake region and the northern source region of the Yangtze River drainage system. According to the statistics (Hu, 1992), 107 lakes with an area above 1.0 km2 each in the Hoh Xil region are in Qinghai. Except for less freshwater and salt lakes, the main type of these lakes is lagoon-brackish lake (Hu, 1992; Wang and Dou, 1998). The lakes are characterized by the apparent seasonal variations that water level is high from May to September and low from October to April of next year. Ulan Ula Lake with an area of approximately 544.5 km2 is the largest lake in the Hoh Xil region (Hu, 1992).

3 Data and methods

3.1 Data source

In order to obtain the data of lake change in the Hoh Xil region, 167 topographic maps at a scale of 1:100,000 and 224 Landsat TM/ETM+ remote sensing images with the spatial resolution of 30 m were collected. The topographic maps were provided by Mapping Agency of General Staff Headquarters of the People’s Liberation Army and the remote sensing images were freely downloaded from USGS website (http://earthexplorer.usgs.gov). Due to large quantities of lakes, we only studied the lakes with an area above 10 km2 each which accounted for 93.87% of the total lake area and could be considered to be able to reflect the lake situation in the Hoh Xil region. Finally, 83 lakes were selected and their detailed information was listed in Table 1. Actually, the selected 83 lakes were distributed in 59 topographic maps mentioned above. In detail, 19, 22, 4 and 5 topographic maps were taken in 1970, 1971, 1973 and 1974, respectively. And the additional 9 topographic maps were taken in 1960. Thus these topographic maps could reflect the status of 83 lakes in the early 1970s.
The acquisition time of Landsat TM/ETM+ remote sensing images were in the early 1990s (1989-1991) and the period from 2000 to 2011 (Table 2). Because inland lakes had significant seasonal changes and the lake water level usually reached the maximum value in the period between September and November (Hu, 1992; Li et al., 2011; Lei et al., 2013), the remote sensing images in this period were collected as much as possible. Due to some reasons such as cloud cover, snow cover, poor data quality or the lack of images, partial lakes were masked or difficult to be extracted by visual inspection. Thus, it was impossible to acquire all images in the same month. According to the statistics, these images were concentratedly acquired in the period from October to December, including 81 images in November, 68 images in October and 63 images in December. In addition, there were 6 images acquired in January, 4 images in September, 1 image in August and 1 image in March, respectively.
Table 1 Lake with the area above 10 km2 in the Hoh Xil region
Name Location*
(°N, °E)
Area (km2) Name Location*
(°N, °E)
Area (km2)
1970s 2000s 1970s 2000s
Ulan Ula 34.81, 90.48 552.30 564.05 Dogai Coring 34.59, 88.95 369.38 476.00
Xijir Ulan 35.21, 90.34 351.83 383.61 Hoh Xil 35.59, 91.14 305.81 319.51
Hoh Sai 35.74, 92.86 265.03 274.38 Huiten Nor 35.55, 91.92 260.00 264.98
Lisioidain Co 35.75, 90.20 229.55 245.56 Dogaicoring Qangco 35.31, 89.26 210.50 302.95
Dorge Co 35.23, 92.14 148.52 206.29 Memar Co 34.22, 82.31 138.04 146.21
Bairab Co 35.03, 83.13 127.62 137.25 Yinma 35.60, 90.62 107.72 108.46
Aru Co 33.99, 82.40 104.72 104.88 Taiyang 35.93, 90.63 101.04 102.59
Xiangyang 35.80, 89.42 98.31 100.19 Heishi Beihu 35.56, 82.75 94.26 99.59
Jianshui 35.30, 83.12 89.24 128.52 Mingjing 35.07, 90.55 87.53 91.42
Qoima Co 33.89, 91.19 86.44 89.22 Yuye 36.01, 88.76 80.87 116.28
Margai Caka 35.13, 86.75 80.08 139.16 Cuodarima 35.33, 91.85 77.29 72.52
Yang 35.43, 84.65 75.44 114.06 Botao 34.01, 89.95 73.22 72.38
Yonghong 35.25, 89.97 70.34 70.47 Telashi 34.81, 92.22 68.82 60.89
Co Nyi 34.57, 87.27 66.66 130.24 Kekao 35.70, 91.37 63.69 62.11
Chamu Co 34.34, 91.59 61.74 68.18 Laorite Co 33.73, 90.01 58.94 59.08
Rola Co 35.41, 88.38 57.68 139.57 Yongbo Co 35.74, 86.69 56.53 60.03
Xuejing 35.98, 87.36 52.78 71.67 Xuelian 34.09, 90.26 51.22 54.74
Deyu Co 35.69, 87.26 47.66 55.30 Zhenquan 35.92, 86.97 43.70 62.20
Xuehuan 35.01, 88.05 41.92 42.56 Xuemei 36.29, 88.27 39.66 46.48
Yongbo 34.96, 89.23 37.74 40.47 Qqiden Co 34.37, 87.49 37.29 32.25
Haiding 35.58, 93.17 35.58 45.60 Weishan 35.96, 89.23 33.85 35.18
Kushuihuan 35.99, 90.12 33.54 35.73 Yinbo 36.19, 88.14 33.12 40.40
Yan 35.53, 93.41 32.65 42.82 Xianhe 35.99, 88.09 32.34 37.10
Huangshui 34.33, 87.70 30.82 28.29 Hulu 34.42, 91.03 29.98 32.12
Dao 34.75, 83.90 29.06 52.82 Chainjoin Co 35.56, 90.22 27.51 34.84
Golu Co 34.60, 92.46 26.05 21.40 Qingwa 34.71, 86.40 25.54 25.45
N3431E8907** 34.31, 90.07 25.34 Longzhou 35.06, 86.93 23.83
Dongyue 34.38, 89.21 23.32 24.50 Chaoyang 35.28, 87.25 22.98 68.40
Qiagong Co 34.43, 82.34 22.87 26.28 Tupo Co 34.51, 87.09 22.45
Hehua 36.14, 88.99 21.32 22.97 Danbing 35.46, 88.45 20.94
Tao 36.17, 89.32 20.18 25.96 Taiping 34.29, 89.71 20.17 25.30
Yishan 35.24, 90.91 18.58 22.11 Yake Co 34.70, 87.19 18.21 2.82
Hengliang 34.88, 89.06 17.85 19.44 Wandou 34.56, 90.85 17.63 18.16
Jieyue 35.07, 90.27 17.37 17.42 Baitan 34.56, 88.58 17.03 20.86
Yueliang 35.61, 90.38 16.02 27.78 Hulu Chi 35.04, 87.02 15.80 80.09
Haobo 34.40, 88.00 15.33 19.47 Yupan 34.91, 88.38 15.26 18.80
Yingtian 34.43, 88.07 14.92 16.70 Yanzi 33.87, 89.93 14.92 17.37
N3517E9155** 35.17, 91.55 14.66 14.13 N3412E8944** 34.12, 89.44 13.82 16.76
Zairizixia 35.23, 91.21 12.81 11.86 Qianshui 34.63, 88.81 12.64
Maria Co 34.20, 91.69 12.57 11.69 Wan’an 34.43, 88.56 12.21 18.24
Shuanglian 35.50, 88.30 10.62 30.02 Gaotai 35.41, 90.96 10.29 10.78
N3531E9312** 35.31, 93.20 10.34

Note: * The location is the geographical coordinate of lake’s centroid; ** denotes the unnamed lake which is labeled using its centroid coordinate. ① is merged with Dogai Coring Lake; ② is merged with Hulu Chi Lake; ③ is merged with Co Nyi Lake; ④ is merged with Rola Co Lake; ⑤ is merged with Dogai Coring Lake; ⑥ is merged with Haiding Lake.

Moreover, in order to grasp the climate change in the last 40 years in the Hoh Xil region, the observations from three meteorological stations of Wudaoliang, Gerze and Shiquanhe were utilized with the aid of China Meteorological Data Sharing Service System (http://cdc.cma.gov.cn). The glacier data in the 1970s and 2000s in the Hoh Xil region were provided by the Project Group of Chinese Glacier Resources and Change Survey funded by the Ministry of Science and Technology.

3.2 Methods

Firstly, wide-range scanner was adopted to scan 167 topographic maps, and the corresponding digital raster images with a resolution of 300 dpi were stored in the storage device. Then, a series of process including registration, visual inspection and digitization of digital topographic maps were completed with the ArcGIS 9.3 software. The cross points of kilometer grid in the topographic maps were used as the control points. The projection of all the images was defined as Gauss-Kruger projection. The precision was one pixel in the process of digitization. Finally, all vector data of lakes were converted into Albers Equal-Area Conic Projection in order to accurately calculate the area of lakes.
Table 2 Landsat TM/ETM+ remote sensing images used in this study
Path/row Image acquisition date
137/035 1991/10/09*; 2000/10/09; 2001/10/28; 2002/10/15; 2003/12/21; 2004/11/05; 2005/12/26;
2006/11/11; 2007/10/05*; 2007/11/14; 2008/12/18; 2009/12/21; 2010/11/22; 2011/11/25
138/035 1990/11/14*; 2000/12/27*; 2001/10/03; 2002/10/06; 2003/10/09; 2004/12/30; 2005/12/27;
2006/12/20; 2007/01/29*; 2007/11/21; 2008/10/22; 2009/11/26; 2010/10/12; 2011/10/31
138/036 1990/11/14*; 2000/12/27*; 2001/10/03; 2002/10/06; 2003/10/09; 2004/10/19*; 2004/12/30;
2005/12/17; 2006/11/02; 2006/11/10*; 2007/11/21; 2008/12/01; 2008/12/09; 2009/10/25;
2010/12/25; 2011/12/18
138/037 1990/11/14*; 2000/10/16; 2001/10/19; 2002/10/22; 2003/10/09; 2004/10/11; 2005/12/17;
2006/12/20; 2007/10/20; 2008/01/16*; 2008/12/17*; 2009/10/25; 2010/12/31; 2011/12/18
139/035 1989/11/02*; 2000/10/07; 2001/10/26; 2002/10/13; 2003/12/19; 2004/11/03; 2005/11/22;
2006/10/08; 2007/10/11; 2008/12/16; 2009/11/01; 2010/12/06; 2011/10/22
139/036 1989/10/01*; 2000/10/07; 2000/11/16*; 2001/11/11; 2002/10/13; 2003/10/16; 2004/10/18;
2005/11/22; 2006/09/30*; 2006/11/09; 2007/12/30; 2008/12/16; 2009/11/01; 2010/12/06; 2011/10/22
139/037 1990/11/05*; 2000/12/18*; 2001/11/11; 2002/12/16; 2003/10/16; 2004/11/19; 2005/11/14*;
2005/12/08; 2006/11/09; 2007/12/30; 2008/12/16; 2009/12/03; 2010/12/06; 2011/12/09
140/035 1992/09/30; 2000/11/07*; 2001/10/01; 2002/10/04; 2003/10/07; 2004/10/25; 2005/12/15;
2006/10/07*; 2007/11/03; 2008/12/07; 2009/10/23; 2009/11/24; 2010/11/27; 2011/11/14
140/036 1992/11/17*; 2000/10/03; 2000/11/07*; 2001/10/01; 2002/10/04; 2003/10/07; 2004/10/25;
2005/12/15; 2006/10/07*; 2006/10/31; 2007/09/24*; 2007/12/05; 2008/12/07; 2009/09/29;
2010/11/11; 2011/11/30
141/035 1989/01/24*; 2000/10/29*; 2001/11/01*; 2002/10/11; 2003/10/14; 2004/11/17; 2005/11/20;
2006/10/06; 2007/11/26; 2008/11/12; 2009/10/30; 2010/12/04; 2011/12/23
141/036 1989/01/24*; 2000/10/13*; 2000/11/30*; 2001/11/01*; 2001/12/03; 2002/10/11; 2003/10/14;
2004/11/17; 2005/11/20; 2006/10/06; 2007/12/28; 2008/11/12; 2009/10/30; 2010/10/17; 2010/11/02;
2011/12/23
142/036 1989/03/04*; 2000/10/28; 2001/11/16; 2002/11/03; 2003/11/22; 2004/12/10; 2005/12/13;
2006/10/29; 2007/11/17; 2008/11/03; 2009/11/06; 2010/11/17*; 2011/11/28
143/035 1989/01/22*; 2000/11/04; 2001/11/23; 2002/11/26; 2003/11/29; 2004/11/15; 2005/11/18;
2006/10/12*; 2007/12/26; 2008/10/25; 2009/12/31; 2010/10/15; 2011/11/19
143/036 1989/01/22; 2000/11/04; 2001/11/23; 2002/11/26; 2003/11/29; 2004/11/15; 2005/12/20; 2006/11/21;
2007/12/26; 2008/11/10; 2009/12/31; 2010/11/16; 2011/12/21
144/035 1990/08/20*; 2000/12/29; 2001/11/14; 2002/10/16; 2003/11/20; 2004/12/08; 2005/12/11;
2006/11/12; 2007/10/30; 2008/11/01; 2009/12/14*; 2010/11/07; 2011/11/26
144/036 1992/10/12*; 2000/12/13; 2001/11/14; 2002/11/01; 2003/11/04; 2004/12/08; 2005/11/25;
2006/12/30; 2007/12/01; 2008/12/03; 2009/12/06; 2010/12/01*; 2011/11/26

Note: * denotes Landsat TM remote sensing image and NA denotes Landsat ETM+ remote sensing image.

With the ENVI 4.7 software, all Landsat TM/ETM+ remote sensing images were rectified to the corresponding topographic maps by means of georeference. The mean error of image correction was controlled within half a pixel and the maximum error was limited in one pixel. Although many automatic extraction approaches of lake boundary from remote sensing image had been adopted, including the normalized difference water index (NDWI), the band ratio index, and the “global-local” step-by-step iteration method, the high-quality remote sensing image was required (McFeeters, 1996; Luo et al., 2009). Because of the restricted acquisition period of images and the bad stripes in Landsat ETM+ images in “SLC-off” model after May 31, 2003, the artificial visual interpretation method should be adopted. In ArcGIS 9.3 software, false color combination of remote sensing image was firstly carried out so as to distinguish the lake from others. Then the manual digitalization method was applied to obtain the vector data of lake boundary, based on the rules established by the Project Group of Chinese Lake Water Quality, Water Volume and Biological Resources Survey funded by the Ministry of Science and Technology (Ma et al., 2011). The precision was also one pixel in the process of digitization.
Because the data of precipitation and evaporation in the Hoh Xil region were not available, the potential evapotranspiration, as the reference of lake evaporation (Wang et al., 2012), was calculated with the observations from Wudaoliang, Gerze and Shiquanhe meteorological stations with Penman-Monteith Equation recommended by FAO (Allen et al., 1998).

4 Results and discussion

4.1 The general trend of lake change in the Hoh Xil region

The results of lake boundary digitization indicated that the total area of 83 lakes in the Hoh Xil region was 5873.91 km2 in the early 1970s, 5263.71 km2 in the early 1990s, 5952.38 km2 in 2000, and 7446.94 km2 in 2011. As shown in Figure 2, the total area of lakes was firstly decreased and then increased. And the trend was basically consistent with the result obtained by Li et al. (2011). From the early 1970s to the early 1990s, the total area of lakes significantly decreased by 610.20 km2 (10.39%). Instead, the total area in 2000 increased to the value, which was slightly more than that in the 1970s. After 2000, the total lake area increased by 1494.56 km2 (25.11%) with a rapid increasing trend. Especially in the periods from 2001 to 2002 and from 2009 to 2011, the growth rate of lake area was apparently higher than that in other periods.
Figure 2 The area variation of lakes in the Hoh Xil region during 1970-2011
In the 1970s, there was only one lake with an area above 500 km2 in the Hoh Xil region, e.g. Ulan Ula Lake of 552.30 km2. There were five lakes with an area between 250 km2 and 500 km2, including Dogai Coring Lake (369.38 km2), Xijir Ulan Lake (351.83 km2), Hoh Xil Lake (305.81 km2), Hohsai Lake (265.03 km2) and Huiten Nor Lake (260.00 km2). The area of the six lakes reached one-third of the total area of the lakes in the Hoh Xil region. In addition, there were 8 lakes with the area between 100 km2 and 250 km2 and 20 lakes with an area between 50 km2and 100 km2. And the other 49 lakes with an area between 10 km2 and 50 km2 merely accounted for 19.60% of the total area of the lakes in the region. From the early 1970s to 2011, the lakes with the maximum increased area included Dogai Coring Qangco Lake (increased by 146.63 km2), Dogai Coring Lake (increased by 106.62 km2) and Rola Co Lake (increased by 106.29 km2). However, the area of Huiten Nor Lake and Yake Co Lake significantly decreased by 89.57 km2 and 14.42 km2, respectively.
Figure 3 shows the area-number change of lakes with different area ranks in the past 40 years in the Hoh Xil region. From the early 1970s to the early 1990s, there was an obviously decreasing trend in lake area, except that eight lakes with an area between 100 km2and 250 km2 slightly increased. However, it was found that the area of seven lakes decreased in this area rank expect for Dorge Co Lake in which the increased area (38.46 km2) was just more than the decreased area (21.90 km2) of other seven lakes. As for the number of lakes, the numbers of only two area ranks (50-100 km2 and 10-50 km2) were changed because the areas of Margai Caka Lake and Xuejing Lake were dramatically decreased by 57.53 km2 and 7.19 km2, respectively. Therefore, in this stage, both the total area and the area of each rank were in the decreasing trend in the Hoh Xil region. From the early 1990s to 2000, except that the area of lake with an area above 500 km2 (Ulan Ula Lake) slightly decreased, the area of lakes in other area ranks showed an increasing trend. The number of lakes with the area of 50-100 km2 and 100-250 km2 was respectively increased by two (Chaoyang Lake and Xuejing Lake) and one (Margai Caka Lake). Correspondingly, the number of lakes with the area of 10-250 km2 was decreased by three. From 2000 to 2011, the area of the lakes in three area ranks above 100 km2 was significantly increased. Except for the rank with the area above 500 km2 (Ulan Ula Lake), the quantities of other two ranks were increased by 6 and 16, respectively. In addition, the quantities and areas of two area ranks less than 100 km2 were decreased and the number of the lakes with the area between 10 km2 and 50 km2 was decreased by 13. But this decreasing trend did not indicate that the total area of the two ranks was decreased. On the contrary, the truth was that lakes rapidly expanded so that they were classified as the higher rank in the statistics. Therefore, it was undoubted that the area of lakes as a whole was increased after 2000 in the Hoh Xil region.
Figure 3 Variation of area and number of different-sized lakes in the Hoh Xil region

4.2 Spatial change features of the lakes in the Hoh Xil region

In order to further explore the evolution process of lakes in the Hoh Xil region, we systematically analyzed the change of lake area from 2000 to 2011 and found that the lakes were not all in the increasing trend. According to the variation status of lake area, the change trends were divided into the following seven types: increase; decrease; strongly fluctuate; firstly increase and then decrease; firstly increase and then stabilize; firstly decrease and then increase; firstly increase, then decrease and re-increase. It should be noted that some lakes were merged together due to their rapid expansion. The number of lakes with an area above 10 km2 decreased from 83 in the 1970s to 77 in 2011. The merged lakes included the following five lake combinations: Rola Co Lake and Danbing Lake; Dogai Coring Lake, Qianshui Lake and N3431E8907 Lake; Hulu Chi Lake and Longzhou Lake; Co Nyi Lake and Tupo Co Lake; Haiding Lake and N3531E9312 Lake.
The area variation trends and positions of lakes in the Hoh Xil region are exhibited in Figure 4. Most of the lakes (44) showed an increasing trend and were mainly distributed in the northern, western and central parts of the study area; 10 lakes with the tendency of area increase-steadiness were distributed in the eastern and southern parts; 7 lakes with the increase-decrease trend were scattered in the study area; 5 lakes with the increase-decrease-increase trend were generally close to the lakes with the increasing trend; the other three variation trends respectively included three lakes, which were mainly distributed in the southern and central parts of the Hoh Xil region. In detail, the areas of Gaotai Lake, Jieyue Lake and Chaoyang Lake decreased; Aru Co Lake, Haobo Lake and Yake Co Lake strongly fluctuated; Qingwa Lake, Qoiden Co Lake and Yonghong Lake firstly shrank and then expanded. According to topographic maps and the Record of Chinese Lakes (Wang and Dou, 1998), lakes that strongly fluctuated were mainly located in the upstream and hydraulically connected with other lakes. For example, the water from Aru Co Lake could run into Memar Co Lake; there was one waterway between Haobao Lake and Yingtian Lake. Additionally, these lakes usually had poor water supply, such as Yake Co Lake which had no river or spring supplies and even became completely dry in 1990. Lakes with area decreasing trend and area decrease-increase trend mainly belonged to seasonal overflowing lakes or the lakes without regular supply. For example, Jieyue Lake was a seasonal overflowing lake and its water flowed into Mingjing Lake through the eastern part; the water from Yonghong Lake ran into Xijir Ulan Lake; and Qoiden Lake was mainly supplied with spring.
Figure 4 Area variation tendencies of lakes in the Hoh Xil region during 2000-2011
In conclusion, the area of lakes in the Hoh Xil region was generally in the increasing trend after 2000. And the regional differences of lake variations were only related to supply ways and water overflow. Yao et al (2012b) pointed out that the violent expansions of Hoh Sai Lake, Haiding Lake and Yan Lake were caused by the considerable water spillover of Huiten Nor Lake in the upstream. The chain reaction resulted by lake change should be the focus on the lake study in the future.

4.3 Causes of lake area change in the Hoh Xil region

Currently, the causes for area changes of the lakes on the Tibetan Plateau were in the controversy. Zhu et al. (2010) believed that water volume growth of Nam Co Lake was mainly resulted by the increase of glacial meltwater. But Ma et al. (2012) and Lei et al. (2013) thought this change was ascribed to the increased precipitation and the decreased lake evaporation. Chu et al. (2012) analyzed water level change of Yamzho Yumco Lake and found that annual precipitation fluctuation was the main cause. And the human activities and artificial projects had little influence on the water level change. Yang et al. (2003) proposed that south-north distance reduction caused by Tibetan Plateau uplift and the neotectonic movement was the main cause for the considerable expansion of Siling Co Lake. But Zhao et al. (2006) did not agree with Yang’s opinion and believed that the main reason was the increased glacier meltwater. For the Hoh Xil region located in the hinterland of the Tibetan Plateau without the influence of human activities, the lake change mainly reflected the change of natural environments. Because there were no observed meteorological data, measured data of glacial mass balance and permafrost evolution, we only tried to propose our opinion on the causes of lake change in the Hoh Xil region, based on the materials from the three meteorological stations mentioned above and the inventory of glaciers.
4.3.1 The influence of climate change on the lake area variation
Figure 5 shows the change of annual precipitation from 1970 to 2011 in Wudaoliang, Gerze and Shiquanhe meteorological stations. Obviously, annual precipitation in Wudaoliang meteorological station was the highest and the average value reached up to 291.4 mm. The annual precipitation was 175.0 mm and 70.5 mm in Gerze and Shiquanhe meteorological station, respectively. It indicated that precipitation was decreased from the east to the west, which was consistent with the spatial pattern of precipitation in the Hoh Xil region.
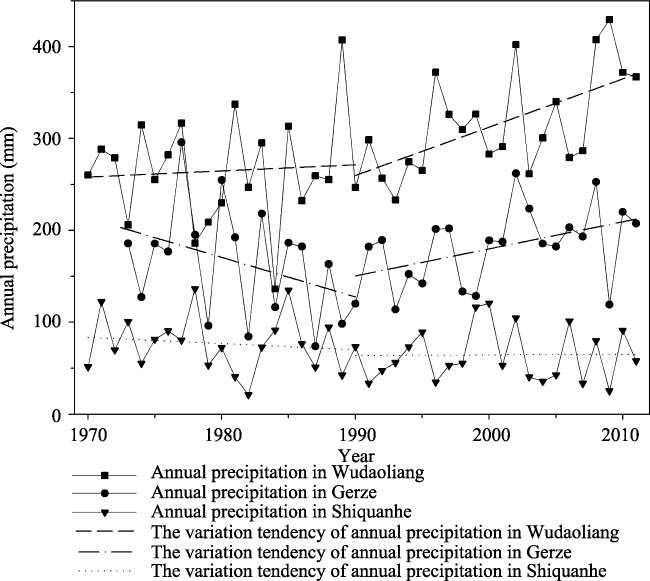
Figure 5 Precipitation variation observed in Wudaoliang, Gerze and Shiquanhe meteorological stations during 1970-2011
From 1970 to 1990, except for Wudaoliang meteorological station, the annual precipitation in the other two meteorological stations was in the decreasing trend. Especially, the annual precipitation in Gerze meteorological station significantly decreased and its declining slope was -4.30 mm·a-1. During the period of 1990-2011, the annual precipitation in Wudaoliang and Gerze meteorological stations showed a significant increasing trend with the slopes of 5.25 mm·a-1 and 2.95 mm·a-1, respectively. By comparing the average annual precipitation in the two periods above, it could be found that the highest increase of annual precipitation (from 265.5 mm to 315.0 mm) happened in Wudaoliang meteorological station. The annual precipitation increased from 166.6 mm to 181.4 mm in Gerze meteorological station while decreased from 77.0 mm to 64.5 mm in Shiquanhe meteorological station. Combined with lake area variation, it was well consistent with the precipitation change in the meteorological stations. For example, from 1970 to 1990, precipitation was generally less and total lake area was correspondingly decreased. Since 2000, especially in 2002 and 2008, annual precipitation in Wudaoliang meteorological station was respectively up to 402.1 mm and 407.5 mm, which were much higher than the annual precipitation in other years. Similarly, annual precipitation in Gerze meteorological station in these two years was also higher. Meanwhile, the area of lakes was abruptly increased. From Figure 1, it could be found that lakes in the study area were mainly located in the eastern part of 81°56'E while Shiquanhe meteorological station (80°05'E, 32°56'N) was far away. It might be responsible for the result that lake area variation was irrelevant to precipitation change in Shiquanhe meteorological station.
Since most of the lakes in the Hoh Xil region belonged to the inland lake, the water loss of lake mainly depended on the evaporation. Wang et al. (2012) calculated the evaporation of lake surface and found that it was in linear relation with potential evapotranspiration calculated by Penman-Monteith equation. The potential evapotranspiration of the three meteorological stations were therefore calculated, as shown in Figure 6. Obviously, the potential evapotranspiration had a significant decreasing trend with the slope of -2.5 mm·a-1, -1.8 mm·a-1 and -1.1 mm·a-1 in Gerze, Shiquanhe and Wudaoliang meteorological station, respectively. Further analysis revealed that the average annual potential evapotranspiration of three meteorological stations were lower during the period of 2000-2011 than that in the study period, indicating that the evaporation of lake surface were in the overall decreasing trend in the Hoh Xil region. So the increased precipitation and the decreased evaporation broke the balance of lake water volume, which was mainly responsible for area change of lakes in the Hoh Xil region.
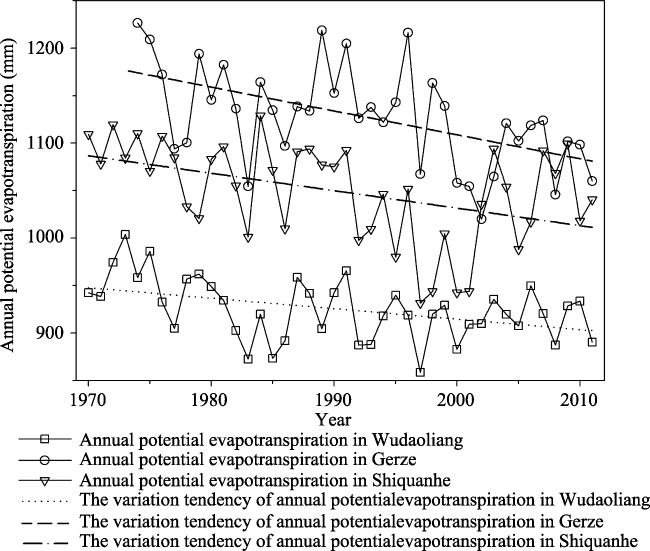
Figure 6 The variation of potential annual evapotranspiration calculated from Wudaoliang, Gerze and Shiquanhe meteorological stations during 1970-2011
4.3.2 The influence of glaciers and permafrost on lake change variation
In addition to precipitation, glacier meltwater and permafrost water release were also the main supply of lakes on the Tibetan Plateau (Zhao et al., 2006; Li et al., 2011). According to the glacier data provided by the Project Group of Chinese Glacier Resources and Change Survey, the area of glaciers in the Hoh Xil region was 2423.60 km2 in the early 1970s and 2243.35 km2 in the late 2000s. It indicated that glaciers were generally in the retreating status in the past 40 years. In the study area, except for Taiyang Lake being close to Malan Ice Cap (the distance was about 2.13 km), the other lakes were far away from the glaciers. If some factors including glacial meltwater evaporation, infiltration along the rivers as well as no supply of glacial meltwater for some lakes were considered, the supply from glacial meltwater was very limited. From the monitoring result of permafrost in Wudaoliang, the permafrost thickness had been thin and the active layer had become thick since the 1980s. In addition, the continuous frozen days of permafrost were decreased (Zhao et al., 2000). However, the liquid from the underground ice accounted for only small proportion (Yao, 2002). Thus, glacier meltwater and permafrost water release might be one of the causes for lake expansion in the Hoh Xil region, but it was not the dominant one.

5 Conclusions

(1) In the past 40 years, lakes in the Hoh Xil region experienced a significant process from shrinkage to expansion. The total area of 83 lakes with an area above 10 km2 each increased from 5873.91 km2 to 7446.94 km2. From the early 1970s to the early 1990s, lake area was decreased by 610.20 km2. From the 1990s to the early 2011, the lake area was increased by 2183.23 km2. Especially during the period of 2000-2011, the expansion rate of lakes was remarkably promoted.
(2) From 2000 to 2011, there was a regional difference among the area variation of lakes in the Hoh Xil region. Over half of the lakes expanded and were clustered in the northern, central and western parts of the region. Some lakes experienced even merge or lake water spillover. And fewer lakes that showed an area decreasing trend or strongly fluctuated were scattered in the central and southern parts. The dynamic change of these lakes was related to their own supply conditions or the hydraulic connection with lakes in the downstream.
(3) Because of the lack of data, the change of lake water volume and the number of lakes’ input and output could not be provided in the view of water balance. The preliminary analysis showed that the variations of lake area were mainly related to precipitation and evaporation in the Hoh Xil region. The secondary causes were the glacial meltwater increase and permafrost water release.

The authors have declared that no competing interests exist.

1
Allen R G, Perreira L S, Raes D, 1998. Crop Evapotranspiration: Guidelines for Computing Crop Water Requirements. FAO Irrigation and Drainage Paper 56. Rome, 1-15.

2
Bian Duo, Bian Baciren, La Baet al., 2010. The response of water level of Selin Co to climate change during 1975-2008.Acta Geographica Sinica, 65(3): 313-319. (in Chinese)

3
Bian Duo, Yang Zhigang, Li Linet al., 2006. The response of lake area change to climate variations in north Tibetan Plateau during last 30 years.Acta Geographica Sinica, 61(5): 510-518. (in Chinese)

4
Chu Duo, Pu Qiong, Wang Duiet al., 2012a. Water Level variations of Yamzho Yumco Lake in Tibet and the main driving forces.Journal of Mountain Science, 30(2): 239-247. (in Chinese)

5
Chu Duo, Pu Qiong, Zhu Lipinget al., 2012b. Remote sensing analysis on lake area variations of Yamzho Yumco in Tibetan Plateau over the past 40a.Journal of Lake Sciences, 24(3): 494-502. (in Chinese)

6
Ding Yongjian, Liu Shiyin, Ye Baishenget al., 2006. Climatic implications on variations of lakes in the cold and arid regions of China during the recent 50 years.Journal of Glaciology and Geocryology, 28(5): 623-632. (in Chinese)

7
George B S, Kang A, Hashi T Det al., 2007. A winter wildlife survey in the northern Qiangtang of Tibet Autonomous Region and Qinghai Province, China.Acta Theriologica Sinica, 27(4): 309-316.

8
Hu Dongsheng, 1992. Investigation and study on lake resources in Kekexili region.Arid Land Geography, 15(3): 50-58. (in Chinese)

9
Hu Dongsheng, 1994. Lakes survey in Kekexili region.Journal of Salt Lake Science, 2(3): 17-21. (in Chinese)

10
Jiang Yongjian, Li Shijie, Shen Defuet al., 2012. Climate change and its impact on the lake environment in the Tibetan Plateau in 1971-2008.Scientia Geographica Sinica, 32(12): 1503-1512. (in Chinese)

11
La Ba, Bian Duo, Ci Zhenet al., 2012. Study on the change of lake area and its causes in the Mapangyong Co basin in Tibet.Arid Zone Research, 29(6): 992-996. (in Chinese)

12
Lei Y, Yao T, Bird B Wet al., 2013. Coherent lake growth on the central Tibetan Plateau since the 1970s: Characterization and attribution.Journal of Hydrology, 483: 61-67.

13
Li Junli, Sheng Yongwei, Luo Jianchenget al., 2011. Remotely sensed mapping of inland lake area changes in the Tibetan Plateau.Journal of Lake Sciences, 23(3): 311-320. (in Chinese)

14
Li Zhiguo, 2012. Glaciers and lakes changes on the Qinghai-Tibet Plateau under climate change in the past 50 years.Journal of Natural Resources, 27(8): 1431-1443. (in Chinese)

15
Li Zhiguo, Yao Tandong, Ye Qinghuaet al., 2011. Monitoring glacial lake variations based on remote sensing in the Lhozhag district, eastern Himalayas, 1980-2007.Journal of Natural Resources, 26(5): 836-846. (in Chinese)

16
Luo Jiancheng, Sheng Yongwei, Shen Zhanfenget al., 2009. Automatic and high-precise extraction for water information from multispectral images with the step-by-step iterative transformation mechanism.Journal of Remote Sensing, 13(4): 610-615. (in Chinese)

17
Ma R, Yang G, Duan Het al., 2011. China's lakes at present: Number, area and spatial.Science China Earth Sciences, 54(2): 283-289.

18
Ma Yingzhao, Yi Chaolu, Wu Jiazhanget al., 2012. Lake surface expansion of Nam Co during 1970-2009: Evidence of satellite remote sensing and cause analysis.Journal of Glaciology and Geocryology, 34(1): 81-88. (in Chinese)

19
McFeeters S K, 1996. The use of normalized difference water index (NDWI) in the delineation of open water features.International Journal of Remote Sensing, 17(7): 1425-1432.

20
Shao Zhaogang, Zhu Dagang, Meng Xianganget al., 2007. Changes of rivers and lakes on the Qinghai-Tibet Plateau in the past 25 years and their influence factors.Geological Bulletin of China, 26(1): 1633-1645. (in Chinese)

21
Shi Yafeng, 2005. A Concise Glacier Inventory of China. Shanghai: Shanghai Popular Science Press, 54-100. (in Chinese)

22
Song Ci, Pei Tao, Zhou Chenghu, 2012. Research progresses of surface temperature characteristic change over Tibetan Plateau since 1960.Progress in Geography, 31(11): 1503-1509. (in Chinese)

23
Wan Wei, Xiao Pengfeng, Feng Xuezhiet al., 2010. Remote sensing analysis for changes of lakes in the southeast of Qiangtang area, Qinghai-Tibet Plateau in recent 30 years.Journal of Lake Sciences, 22(6): 874-881. (in Chinese)

24
Wang Sumin, Dou Hongshen, 1998. Records of Chinese Lakes. Beijing: Science Press, 398-502. (in Chinese)

25
Wang W, Yao T, Yang X, 2011. Variations of glacial lakes and glaciers in the Boshula mountain range, southeast Tibet, from the 1970s to 2009.Annals of Glaciology, 52(58): 9-17.

26
Wang Xin, Liu Shiyin, Yao Xiaojunet al., 2010. Glacier lake investigation and inventory in the Chinese Himalayas based on the remote sensing data.Acta Geographica Sinica, 65(1): 29-36. (in Chinese)

27
Wang Zhijie, Li Changyou, Jia Keliet al., 2012. Calculation and characteristics of Hulun Lake surface evaporation.Journal of Arid Land Resources and Environment, 26(3): 88-95. (in Chinese)

28
Xin Xiaodong, Yao Tandong, Ye Qinghuaet al., 2009. Study of the fluctuations of glaciers and lakes around the Ranwu Lake of southeast Tibetan Plateau using remote sensing.Journal of Glaciology and Geocryology, 31(1): 19-26. (in Chinese)

29
Yang Rihong, Yu Xuezheng, Li Yulong, 2003. The dynamic analysis of remote sensing information for monitoring the expansion of the Selincuo Lake in Tibet.Remote Sensing for Land & Resources, 56: 64-67. (in Chinese)

30
Yao T, Thompson L, Yang Wet al., 2012a. Different glacier status with atmospheric circulations in Tibetan Plateau and surroundings.Nature Climate Change, 2: 663-667.

31
Yao Tandong, 2002. Dynamic Characteristics of Cryosphere in the Central Tibetan Plateau. Beijing: Geological Publishing House, 199-206. (in Chinese)

32
Yao Xiaojun, Liu Shiyin, Sun Meipinget al., 2012b. Changes of Kusai Lake in Hoh Xil region and causes of its water overflowing.Acta Geographica Sinica, 67(5): 689-698. (in Chinese)

33
Zhang B, Wu Y, Zhu Let al., 2011. Estimation and trend detection of water storage at Nam Co Lake, central Tibetan Plateau.Journal of Hydrology, 405: 161-170.

34
Zhao Lin, Cheng Guodong, Li Shuxunet al., 2000. Process of freezing and thawing of permafrost active layers near Wudaoliang on Tibetan Plateau.Chinese Science Bulletin, 45(11): 1205-1211. (in Chinese)

35
Zhao Yuanyi, Zhao Xitao, Zheng Mianpinget al., 2006. The denivellation of Bankog Co in the past 50 years, Tibet.Acta Geologica Sinica, 80(6): 876-884. (in Chinese)

36
Zhu L P, Xie M P, Wu Y H, 2010. Quantitative analysis of lake area variations and the influence factors from 1971 to 2004 in the Nam Co Basin of the Tibetan Plateau.Chinese Science Bulletin, 55: 1294-1303.

Outlines

/