Research Articles

Multi-scale integrated assessment of urban energy use and CO2 emissions

  • ZHANG Lijun , 1, 2 ,
  • LIU Gangjun 3 ,
  • QIN Yaochen , 1, 2, *
Expand
  • 1. College of Environment and Planning, Henan University, Kaifeng 475004, Henan, China
  • 2. Henan Collaborative Innovation Center for Coordinating Industrialization, Urbanization and Agriculture Modernization in Central Economic Zone, Kaifeng 475004, Henan, China
  • 3. College of Science, Engineering and Health, RMIT University, Melbourne 3000, Australia

*Corresponding author: Qin Yaochen (1959-), Professor, E-mail: .

Author: Zhang Lijun (1985-), Lecturer, specialized in regional sustainable development. E-mail:

Received date: 2014-01-06

  Accepted date: 2014-02-20

  Online published: 2014-04-20

Supported by

National Natural Science Foundation of China, No.41171438.National Basic Research Program of China (973 Program), No.2012CB955804.National Natural Science Foundation of China, No.41201602

Copyright

Journal of Geographical Sciences, All Rights Reserved

Abstract

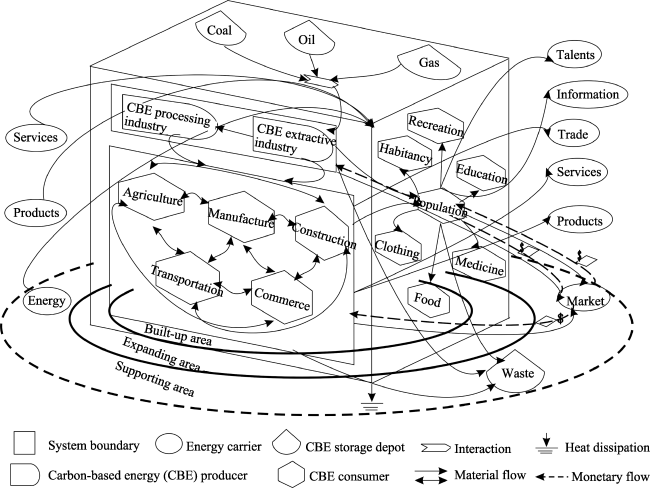
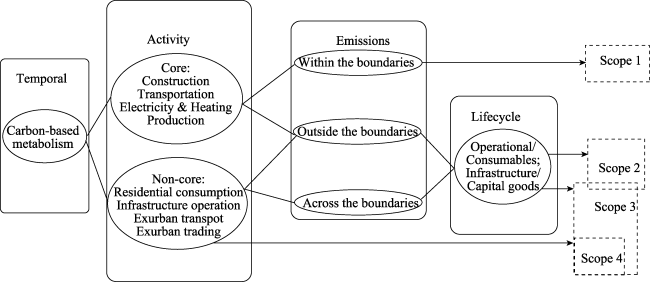
Accurate and detailed accounting of energy-induced carbon dioxide (CO2) emissions is crucial to the evaluation of pressures on natural resources and the environment, as well as to the assignment of responsibility for emission reductions. However, previous emission inventories were usually production- or consumption-based accounting, and few studies have comprehensively documented the linkages among socio-economic activities and external transaction in urban areas. Therefore, we address this gap in proposing an analytical framework and accounting system with three dimensions of boundaries to comprehensively assess urban energy use and related CO2 emissions. The analytical framework depicted the input, transformation, transfer and discharge process of the carbon-based (fossil) energy flows through the complex urban ecosystems, and defined the accounting scopes and boundaries on the strength of ‘carbon footprint’ and ‘urban metabolism’. The accounting system highlighted the assessment for the transfer and discharge of socio-economic subsystems with different spatial boundaries. Three kinds methods applied to Beijing City explicitly exhibited the accounting characteristics. Our research firstly suggests that urban carbon-based energy metabolism can be used to analyze the process and structure of urban energy consumption and CO2 emissions. Secondly, three kinds of accounting methods use different benchmarks to estimate urban energy use and CO2 emissions with their distinct strength and weakness. Thirdly, the empirical analysis in Beijing City demonstrate that the three kinds of methods are complementary and give different insights to discuss urban energy-induced CO2 emissions reduction. We deduce a conclusion that carbon reductions responsibility can be assigned in the light of production, consumption and shared responsibility based principles. Overall, from perspective of the industrial and energy restructuring and the residential lifestyle changes, our results shed new light on the analysis on the evolutionary mechanism and pattern of urban energy-induced CO2 emissions with the combination of three kinds of methods. And the spatial structure adjustment and technical progress provides further elements for consideration about the scenarios of change in urban energy use and CO2 emissions.

Cite this article

ZHANG Lijun , LIU Gangjun , QIN Yaochen . Multi-scale integrated assessment of urban energy use and CO2 emissions[J]. Journal of Geographical Sciences, 2014 , 24(4) : 651 -668 . DOI: 10.1007/s11442-014-1111-5

1 Introduction

The pressure on natural resource and the environment exerted from urban socio-economic activities has become a critical issue of regional sustainability. Paired with rapid urbanization, cities have profound influence on fossil (carbon-based) energy consumption and carbon emissions. It is estimated that cities are responsible for over 70% of global energy-related CO2 emissions (Kort et al., 2012). As a consequence, urban carbon-based energy metabolism is of increasing interest to the academic community and government policy makers. They seek to assess the fossil energy use and related CO2 emissions to search for ways to reach emission reduction goals (While et al., 2010; Lazarus et al., 2013; Feng et al., 2013). There have been a vast number of contributions to the carbon emissions accounting literature at national or regional level. Most studies typically demonstrated urban energy-induced emissions trajectory through downscaling the regional emissions from production or consumption based principles. The production based accounting principles estimated the direct emissions within the city boundaries according to IPCC guidelines for national greenhouse gas inventories (Zheng et al., 2011; Gurney et al., 2012; Marcotullio et al., 2013). The consumption based accounting principles estimated the embodied emissions resulting from the supply chain of goods and services, mainly including the direct and the indirect emissions from the final consumption of socio-economic activities (Lin et al., 2013; Minx et al., 2013; Onat et al., 2014). Furthermore, large amounts of CO2 emissions generated from important urban infrastructures (such as water-, power- and fuel-supply networks and transportation commuter-sheds) occur across the urban boundaries (Chavez et al., 2013). Therefore, the transboundary infrastructure supply chain emission footprint has become a new concern.
Previous studies have demonstrated production-, consumption- and infrastructure-based urban carbon emission trajectories from perspectives of energy economics, resources and environment, civil engineering and industrial ecology. However, very few studies comprehensively and systematically discussed geographical features of carbon emissions in the process of economic globalization and regional integration, as well as the natural subsystems’ energy capacity for supporting the activities taking place in the socio-economic subsystems. Urban ecosystems are typically perceived as living organisms with the metabolic process of production and consumption of human activities (Wolman, 1965; Kennedy et al., 2007). Hence, urban metabolism could depict the circulation of materials and energy flow between urban areas and the surroundings. Situated in a nested and tiered system, urban metabolisms also allow more comprehensive and integrated assessment of the patterns and processes of energy consumption (Pincetl et al., 2012). Yet few have yet articulated energy-induced CO2 emissions as a result of the interaction of socio-economic activities. The analysis combining urban metabolism with CO2 emissions accounting can help to address one of the most important issues of urban sustainability (Ramaswami et al., 2012): how to assess fossil energy use and CO2 emissions systematically and holistically.
In the discussion that follows, we attempt to develop an integrated analysis framework to assess energy use and CO2 emissions in urban complex ecosystems with a perspective of energy flow metabolism. We build a conceptual model of urban carbon-based energy metabolism to evaluate energy use CO2 emissions with three kinds of boundaries and four types of scopes. The main purpose of this study is to propose a set of activity based methods to fill the gap between production and consumption based accounting on CO2 emissions at the urban scale. The integrated analysis can illustrate the process of carbon-based energy flow metabolism and give account of energy flow footprint in the natural-social-economic systems. The comprehensive evaluation of energy flow metabolism, in turn, will provide insights for low carbon development and the sustainable symbiosis between human beings and the environment.

2 An analytical framework for urban carbon-based energy metabolism

2.1 Conceptual model

The term ‘metabolism’ derived from Greek essentially means “change or transform” and has been widely used in biochemistry and ecology at present. It was firstly employed to analyze the metabolism of cities by Wolman (1965). He suggested that urban metabolism encompasses all the materials and commodities along with the waste disposal and management, which are supplied to maintain the living, work and recreation of urban residents. Kennedy et al. (2007) further argued that urban metabolism is the sum total of the technical and socioeconomic processes that occur in cities, resulting in growth, production of energy, and elimination of waste. In general, cities could be analogized to organisms and the interactions between human and the environment could be recognized as the metabolic processes accordingly. The stability and growth of urban organism were maintained through the metabolic process with energy transformation and materials circulation, including resource exploitation, processing and manufacturing, product consumption, waste disposal and cyclic regeneration. Thereinto, fossil fuels or carbon-based energy metabolism is one of the basic motivations to advance the operation of urban complex ecosystems.
Urban ecosystems are open and complex systems ranging from the local to global scale. There are large amounts of people, goods, cash, and information flows between the urban core area (including the built-up area and the expanding area) and its hinterland (i.e. the supporting area). As depicted in Figure 1, urban carbon-based energy flow metabolism incorporates the metabolic processes with the input, transformation, transfer, discharge and treatment of fossil energy in urban complex ecosystems. The sources of carbon-based energy include the primary energy (such as coal, oil, and natural gas) and the secondary energy (such as carbon coke, gasoline, kerosene, electricity and heat) that are converted and processed from the primary energy. The boundaries of urban systems may be drawn to cover the built-up area, the expanding area, or even the supporting area. The built-up area and the continuously expanding area often have corresponding specific administrative or functional boundaries (e.g. the municipal districts or the metropolitan area) (Agostinho, 2013).
In practical terms, the carbon-based energy input means the primary and secondary carbon-based energy supply from natural subsystems. The input includes the supply of local carbon-based energy ‘repository’ (coal, petroleum, natural gas, etc.) and the import from its hinterland. The carbon-based energy transformation means the conversion from primary to secondary carbon-based energy, which is part of the carbon-based energy input and can be expressed by the secondary energy production. The amount of carbon-based energy input can be evaluated in terms of final carbon-based energy consumption without considering the transmission losses. The indicators expressed by input and transformation of urban carbon-based energy depict an interactive interface between human and the environment. Moreover, urban carbon-based energy metabolism can be divided into two categories in accordance with the local carbon-based energy supply from natural subsystems and the final consumption of socio-economic subsystems. The urban carbon-based energy metabolism is attributed to autotrophic metabolism when the production of primary and secondary carbon-based energy is greater than or equal to its final consumption. Otherwise, it is attributed to parasitic metabolism.
Figure 1 The flow diagram of urban carbon-based energy metabolism
The carbon-based energy transfer implies the carbon-based energy exchanged within and among the natural, social, economic subsystems through industrial linkage. There are complex networks between the various components (i.e. industrial, commercial sectors) in socio-economic subsystems. As a result, the carbon-based energy transfer contains not only the direct transfer caused by socio-economic activities, but also the indirect transfer stemmed from the entire life cycle of products and services. In general, carbon-based energy in social subsystems is transferred under the action of human life such as feeding, clothing, sheltering, traveling and entertaining. Carbon-based energy in economic subsystems is transferred due to input-output linkages between the primary, secondary and tertiary industrial sectors. Thereinto, the energy production industries (such as the mining and the energy processing industries) exhibit the closest connections between the socio-economic subsystems and the natural subsystems. The indicator expressed by urban carbon-based energy transfer unravels the situation of strained relationships between human and the environment, viewing from the effects and influence of socio-economic subsystems on natural subsystems. The direct and indirect carbon-based energy transfer can be used to assess the resource pressures in different regions due to socio-economic activities. The direct transfer evaluates the resource pressures in urban core area, while the indirect transfer evaluates the resource pressures in its supporting area.
The discharge of carbon-based energy is the emissions of pollutants from fossil fuel combustion in the process of energy material flow, such as CO2 and SO2. The amount of discharge is a function of the amount of transfer from carbon-based energy. The total emissions can be calculated in line with the amount of transfer and the corresponding energy conversion factors. This indicator assesses the environmental impact from socio-economic activities. The treatment of carbon-based energy covers the separation, recovery, dispose and effective use of pollutants, such as carbon capture and sequestration. In view of the enormous pressure of global warming and the present technical restrictions of carbon-based energy processing, this research focuses on the metabolic process with fossil energy input, transformation transfer, and CO2 emissions. From the perspective of carbon-based energy metabolic characteristics, carbon-based energy input and transformation are the processes with fossil energy initially absorbed and processed by urban complex ecosystem. As for an open and complex urban ecosystem, the input and transformation of carbon-based energy typically required the resource support from the hinterland. Carbon-based energy transfer and discharge are the processes with fossil energy further absorbed, utilized and waste gas released. As the most intense link of the interaction between human and the environment, the transfer and discharge of fossil energy is one of the most important research fields for scholars of human geography and economic geography.

2.2 Accounting scopes and boundaries

Urban carbon-based energy metabolism analysis can assess the degree of resource utilization and its environmental impact, according to a set of indicators capturing different fossil energy metabolic processes. Each process has its own accounting scope and boundary. Learning from the existing research conducted by Kennedy et al. (2011) and Matthews et al. (2008), the scope of urban carbon-based energy metabolism could be divided into four categories in consideration of urban dynamic nature and complexity. Scope 1 refers to the carbon-based energy use and related CO2 emissions because of fixed and mobile fossil fuel combustion within the city boundaries except for electricity and heat. And Scope 1 covers the total metabolism amount of each site such as buildings and streets, or each sector such as industrial, commercial or residential sector. Scope 2 refers to the purchased electricity and heat use within the city boundaries. It is worth noting that most electricity and heat production and their CO2 emissions are located beyond the city boundaries. Scope 3 refers to the carbon-based energy use and related CO2 emissions embodied in the entire supply chain, generally associated with household consumption, government and capital investments and interurban trade transactions. Scope 4 specially refers to the carbon-based energy use and related CO2 emissions caused by urban commuters’ transportation, the provision for energy infrastructure and urban key material such as food, fuels, cements and water. Scope 4 highlights the impact on natural resource and environment reflected by the openness of cities and is an important constituent part of Scope 3. The input and transformation of urban carbon-based energy metabolism merely account what scopes 1 and 2 have defined, but the transfer and discharge cover all the items within the four categories.
There are some reasons to determine a particular boundary when accounting urban carbon-based energy metabolism with different scopes. Theoretically, products and services have different life cycles and their temporal boundaries should be explicit for accounting. On the other hand, the spatial boundaries of carbon-based energy production and consumption disaccord with each other. Hence, it requires distinguishing the boundaries between activities and emissions. Practically, the regulation and management of socio-economic activities normally subject to administrative boundaries. Thus, it requires setting out the geographical boundary. Figure 2 illustrates the associations between various boundaries and accounting scopes. There are typically four kinds of boundaries as following (Kennedy et al., 2011).
Figure 2 Urban carbon-based energy metabolism scoping and boundaries Note: This figure referred to the previous research conducted by Kennedy et al. (2011).
(1) Temporal boundaries. They are used to define the starting point and time ranges for urban carbon-based energy metabolism studies. With the advance of urbanization process, a city had diverse spatial boundaries at different development stages. To determine the starting point is to explain the geographical range, which is the basic step to define temporal boundaries. A city has a strong seasonal variation in emission-generating activities or in fossil fuel related infrastructure provision. There are also great differences in the life cycle of products. So the averaging period over which emissions are accounted facilitates to compare the measurements between investigated products. In this regard, the urban carbon emissions periods could simply be evaluated annually to display the emissions trends on the whole.
(2) Activity boundaries. They are used to define a clear source for carbon-based energy use and CO2 emissions at different scales of cities. Urban carbon-based energy metabolic activities are divided into core and non-core activities. The carbon-based energy metabolism associated with production is no doubt an important part of core activities. Core metabolic activities also include, inter alias, carbon-based energy use and CO2 emissions in construction and in the processes of transportation, as well as the electricity and heat use and the CO2 emissions along with their production process. Core metabolic activities refer to the items from scopes 1 and 2. Non-core metabolic activities identify the carbon-based energy use and CO2 emissions embodied in household consumption, infrastructure investment, imports and exports of products and service, communication and transportation between urban core area and its suburbs. They cover the items from Scope 3 or Scope 4. Overall, the core carbon-based energy metabolic activities can be greatly managed by municipal government, while the management of none core metabolic activities requires a concerted effort on the regulation of consumer lifestyle from a city together with its hinterland.
(3) Emission boundaries. They are used to identify the location of carbon emission sources. When the fossil energy burns they create CO2 at places where carbon-based energy is consumed, such as coal, oil, natural gas, coke, gasoline and other secondary energy except for electricity and heat. The electricity and heat use has scarcely any damage to local environment, but they generate a large amount of CO2 in the production process outside the city boundaries. In terms of widely accepted principles of production and consumption based accounting, the attribution of emissions posed by electricity use seemed to be contradictory. The CO2 emissions from electricity use were involved in both of these methods sometimes (Chavez et al., 2013; Lin et al., 2013), but most of time they were ignored. Furthermore, neither accounting principles pay close attention to items in scope 4 across the city boundaries, in spite of its significance to open urban territorial systems.
(4) Life cycle boundaries. They are used to define the phases of production, transportation, consumption and disposal of carbon-based energy outside the city boundaries, which supply most of goods, services, and energy to cities. As for physical products and services, CO2 emissions in the production, use, and disposal phases are typically all included. However, the capital goods in the form of urban infrastructure are neglected due to unwanted complexity, such as road networks and power grids. In fact, the carbon-based energy metabolism of urban infrastructure can be resolved according to the activiy and temporal boundaries, covering the items from scopes 2 and 3.

3 Methods for urban energy use and CO2 emissions

Methodologies used to evaluate urban energy-induced CO2 emissions have traditionally focused on the boundaries of emission source. The contradiction in dealing with electricity consumption might cause the CO2 reduction burden shifted to the production site. So we proposed an approach based on activity boundaries to evaluate the energy use and CO2 emissions in cities. It is worth mentioning that energy use can be represented in terms of ‘final energy consumption’ or ‘total energy consumption’. The distinction is that the final energy consumption has no consideration on the energy loss in the process of conversion, transportation and management. The final energy consumption can be obtained from energy balance table, and the total energy consumption directly from the statistics. In addition, the secondary energy not for burning is excluded from the accounting, including petroleum products such as naphtha, paraffin, and coking products such as benzene. Table 1 provides an overview of methods classification and comparison to assess urban energy use, and the CO2 emissions from fuel, electricity and heat use can be calculated by the corresponding emission coefficients (IPCC, 2006).
Table 1 Methods classification for urban energy use assessment
Categories Typical formula Variable explanation Data processing
GBMs City
type
based
UEi=UGDPi*
EIi
i is the i'th city; UE is urban energy consumption; UGDP is national gross product in a city; EI is energy intensity. GDP in municipal district of prefecture-level city can be obtained from statistics. GDP in municipal district of county-level cities and towns, and energy consumption in municipal district and towns is always unavailable, they are derived from estimation (Dhakal, 2009).
Sector/
fuel
type
based
UE=∑UVj,k*
EIj, sk
j is the j'th sector; k is the k'th fuel; UV is sectoral added value. The sectoral added value and energy consumption of various kinds of fuels are obtained from statistics. Industry, construction, transportation, commerce and residential sectors are typically considered into.
Typical
sector
based
UEtrans=∑
VNv*VMTv
*FEv
v is the v'th kind of vehicle; UEtrans is urban transportation energy consumption; VN is the number of vehicles; VMT is vehicle traveled per year; FE is fuel consumption per kilometer vehicle traveled. The number of vehicles is obtained from city statistical yearbook of each city.
Vehicle travels per year and energy consumption of various kinds of vehicles refer to the previous research results (Wang et al., 2010).
UERh=
UER h,s
h is the h'th households; UER is residential energy consumption; s is the s'th kind of energy use. Part of energy consumption data are derived from questionnaire survey on standard households.
Other energy consumption data are estimated based on previous study (Zheng et al., 2011).
Spatial
data
based
UE=UEbuild+
UEindustry+
UEtrans
UEbuild, UEindustry, UEtrans are energy consumption from buildings, industries and transportation in cities. The direct carbon emissions from point and nonpoint source and transportation are obtained from Vulcan data (Parshall, 2010).
UER=∑CFk
UER =∑EUn
CF is fuel consumption; EU is final energy consumption from heating, cooking, lighting and son. The simulation for urban energy consumption at various spatial scales is conducted by DECM model (Cheng, 2011).
FBMs EIO CE=EI’*
(I-A)-1*F
CE is energy consumption in the whole city; EI’ represents the row vector of emergy intensity; I is identity matrix; A is direct consumption coefficient; F’ is the column vector of final demands. The energy consumption induced by final consumption is calculated on the basis of urban and regional input-output table.
LCA I-A is regarded as the lifecycle process with production, transportation, utilization, discharge and so on. F is regarded as functional unit.
EIO-
LCA
CE=EI’’ * (I-A)-1*F’’ EI’’ is the diagonal matrix of emergy intensity; F’’ is the diagonal matrix of final demands. The diagonalization of EI’ could disassemble the impact from carbon-based metabolism into the each linkage of production chain (GDI, 2008).
MFA CEm=CMm*
CAELCA, m
m is the m'th material; CM is the material consumption; CAELCA is the lifecycle energy consumption per unit material. The urban energy consumption is accounted by material flow analysis according to the material balance principle (Codoban, 2008).
EMA EM= EM is the emergy; E is the available energy; τ is solar transformity. Conversion factors of emergy and transformity have corresponding standards (Liu et al., 2012).
G+BMs Hybird
-LCA
CE=∑CEk+
(CEm +
CMfuel,k*
CAELCA,k)
CMfuel is the fuels consumption. The key materials and transboundary transportation occurring across the city boundaries are measured by MAF and LCA methods (Hillman et al., 2010).
Typical
sector
based
CEavation=∑
CEk * Ncity
/Nregion
CEavation is the urban-regional air transportation energy consumption; Ncity and Nregion are the annual number of surface passenger transportation trips from the city to the airport, and from the wider region to the airport. The transboundary air transportation deserves being paid attention to (Kennedy, 2010).
Broadly, there are three kinds of methods to account urban energy use, including the geographical boundaries based methods (GBMs), the footprint based methods (FBMs) and the geographical boundaries plus based methods (G+BMs). The first kind of methods records all the direct carbon-based energy use, electricity and heat use and the related CO2 emissions within the city boundaries. This accounting covers the items from scopes 1 and 2. And the city boundaries are typically identified according to administrative or functionary boundaries, with the study area in terms of urban built-up area, metropolitan area, municipal area, the whole cities and so forth. The second kind of methods estimates all the direct and indirect carbon-based energy use and CO2 emissions associated with final consumption, such as household consumption, government investment and interurban trade transaction. This accounting covers the items from scopes 1, 2 and 3. The third kind of methods addresses all the direct carbon-based energy use and CO2 emissions as well as the indirect energy use and CO2 emissions induced by transboundary infrastructure supply, covering the items from scopes 1, 2 and 4.

3.1 The geographical boundaries based methods

The geographical boundaries based methods are similar to the production-based method to some extent, in that both are carbon emission inventories downscaled from the national level to the local level. The urban emission inventories can be established on urban sectors or various kinds of fuels. The accounting methods based on city types and sector/fuel types are easy to collect materials and data from top to bottom. The accounting scopes at the urban scale are in line with scopes at the national level with high comparability. The accounting method based on typical sectors mainly concerns carbon-based metabolism of the residential sector and the transport sector, which are responsible for most emissions in developed countries and will dominate the total emissions in developing countries. In this case, relevant databases (such as household travel survey database, housing survey database) in the developed countries are of great completeness and precision, and high spatial resolution (e.g. at the zip code and neighbourhood level). But developing countries have a relative lack of survey data and the existing data are of various diameters due to the designing scheme created by different research groups. As a consequence, the data inconsistency results in the research incomparability. The accounting based on spatial data establishes a local level inventory of energy use and CO2 emissions on the grounds of remote sensing (RS) or geographic information system (GIS). The spatial energy metabolism models in urban areas either disaggregate sectoral energy consumption or fuels combustion from the national or regional level, or aggregate energy consumption at the building or neighborhood level from bottom to up.
The accounting method based on city types is recognized to be easy applied and its result is frequently bound up with population size and economic development level. This method can estimate the trajectory of carbon-based energy use and CO2 emissions for the whole city, make comparisons of the total amount of energy use and CO2 emissions among various cities, and upon which, make predictions of urban carbon-based energy use and CO2 emissions to set appropriate energy- and emissions-reduction targets. The methods based on sector/fuel types require a much higher-resolution data than the method based on city types, tending to sum up energy consumption and CO2 emissions of various sectors or fuels. These methods explore the structure of carbon-based energy use and CO2 emissions derived from industrial structure or energy structure. In practice, municipal functional departments such as building department, transportation department, could benefit from these accountings to dictate low-carbon development policies. The method based on spatial data allows municipal authorities to address spatial governance problems in low-carbon ways with the highest-resolution data. However, only a few developed countries have established complete database to assess urban carbon-based energy use and CO2 emissions. Overall, the geographical boundaries based methods estimate the direct carbon-based energy demand and CO2 emissions to maintain the operation of households, companies and government. These methods are applicable to make decision in urban planning process to conserve resource usage and reduce CO2 emissions, as well as to formulate local policies on economic structure adjustment and energy efficiency improvement.

3.2 The footprint based methods

The footprint based methods are based on a relatively transparent, consistent and complete accounting system, with standard data collection and perfect interpretation functionality for model simulations. Economic input-output (EIO) method, lifecycle analysis (LCA) and hybrid economic input-output LCA (hybrid-EIO-LCA) are top-down, bottom-up and comprehensive approaches to analyze carbon-based energy use and CO2 emissions, respectively. Material flow analysis (MFA) and emergy analysis (EMA) are ecological economic indicators to describe the structure, the function, and the ecological process of urban energy use and CO2 emissions.
There are significant differences between the EIO and LCA methods, but in practice, these two methods generally have notational and mathematical similarity (Hertwich, 2005). EIO method highlights the carbon-based energy and CO2 emissions resulted from the input and output linkage of socio-economic activities, with an elaboration on all the direct and indirect energy metabolism associated with production, consumption and commercial intercourse in urban core and supporting area. On the contrary, LCA method emphasizes the carbon-based energy and CO2 emissions from the production, use, and disposal processes of the product life cycle, with an advantage over analysis on emission structure of various products and the identical product at different lifecycle stages. The city-scale IO data utilized in EIO and LCA methods are downscaled from national or regional level, and thus the availability and accuracy of local IO tables determines the rationality of analysis results. In order to refer to the advantage of EIO and LCA methods, hybrid LCA method is designed to assess carbon-based energy and CO2 emissions at each linkage of the supply chain. Particularly, the development of online EIO-LCA modeling software widely promotes the application of this method (GDI, 2008). MFA and EMA methods use the mass balance principle based on First Law of Thermodynamics to account the material and energetic flow occurring through human socio-economic activities of transforming and transferring food, goods, energy, and services within a defined system boundary (Decker et al., 2000). The notable difference is that MFA method traces the inputs, outputs and accumulation of stock within the system, without regard to the energetic metabolism and the quality discrepancy of commodities. EMA method holistically assesses the values of various ecological flows encompassing human flow, material flow, energetic flow, information flow and monetary flow in common units of the solar energy. Whereas, EMA method is still with some defects duo to the absence of the pollutants accounting. Hence, the combination of MFA with EMA can provide more extensive application.
In a word, economic input-output (IO) method is the fundamental to assess the carbon-based energy use and CO2 emissions within footprint area. The expression of this method written in matrix form is listed in Table 1, where the flows in the matrix I-A describing the production technology can be represented in the form of economic flow, material flow or energetic flow. Therefore, IO technique can be integrated into LCA, MFA and EMA methods (Hillman et al., 2010). However, down-scaled IO tables are typically unavailable at the local level, precluding the use in many cities. On the contrary, biophysical methods including MFA, LCA and EMA provide indicators for carbon-based metabolism at all levels of aggregation. These methods are widely used combing with IO technique. For example, Ramaswami et al. (2010) established a demand-centered hybrid life-cycle methodology based on EIO-LCA and MFA methods to assess city-scale greenhouse gas footprints and energy use benchmarks. The footprint based methods, especially the EIO-LCA method, can trace the energy flow metabolism not only related to production process and industrial chains, but also in association with final consumption from households, government and capital investments. These methods develop guidelines for carbon-based energy use and CO2 emissions accounting in cities and their supporting area. Such information empowers local government to shape CO2 emissions from households and industries, and thus facilitate to adjust final consumption structure and industrial production structure. In particular, the footprint based methods provide great insight for the change of residential consumption lifestyle and industrial linkage mode.

3.3 The geographical boundaries plus based methods

The geographical boundaries plus based methods have some coherence with the geographical boundaries based methods and the footprint methods, which is firstly proposed by Ramaswami (2011). Compared to the geographical boundaries based methods, this kind of methods has relatively great capability to manage and control urban scale energy metabolism. These methods assess carbon-based energy and CO2 emissions from not only economic and residential sectors, but also the critical transboundary infrastructure supply chains, such as food, water, fuels and cement, as well as surface and airline travel across co-located cities. Among them, water and energy supply are critical to urban and regional infrastructure planning, and the consumption of urban key materials including food, water, fuels and cement is vital to promote dematerialization and decarbonization to optimize urban energy and material flow. Compared to the footprint based methods, the geographical boundaries plus based methods are more widely applied to curve urban energy-induced CO2 emissions. The main reason is that the management and control for household consumption behavior and inter-regional trade tend to be beyond a defined urban ecosystem, as a result that the relevant policy and decision making formed by the footprint based methods seems not to be effectively implemented.
However, there are still some weaknesses when using these methods to compare the carbon-based energy and CO2 emissions among divergent cities or different areas in the same city. First of all, it is not rational to compare two or more cities in terms of per capita CO2 emissions. Although the emissions from transboundary infrastructure supply have identified part of embodied fossil energy and carbon emissions, a great amount of embodied energy flow is not evaluated. The energy-induced CO2 emissions assessed by this kind of methods actually relate to productivity metrics such as per GDP CO2 emissions. The contrast could be made only if the cities have similar proportion of commercial, industrial and residential activities. Moreover, the calculation results normalized by residents plus employees in a city may be comparable. As a result, it is useful to classify cities into highly producing (industrial or resort communities) cities, trade-balanced cities, and highly consuming (suburban towns dominated by homes) cities (Ramaswami et al., 2011). In addition, the geographical boundaries plus based methods are not capable to explore the spatial differentiation of energy-induced CO2 emissions related to urban form. The analysis on total carbon-based energy use and CO2 emissions imposes restrictions on further illustration of the spatial structure and process of urban environmental responsibility, disadvantaging the implementation of the local carbon emission mitigation strategies.

4 Case studies

4.1 Study area and data

The huge regional differences in China hamper the expansion of low-carbon eco-city in an all-around way, such as population size, industrial structure, economic level, developmental stage, locational conditions and resource endowment. In this paper, the above-mentioned three kinds of approaches were applied to Beijing City to assess the carbon-based energy use and CO2 emissions. As a city having experienced rapid urbanization and industrialization in Bohai Sea Rim economic circle in North China, Beijing is the second largest energy consuming city of China and the total energy consumption increased by about 2.6 times during 1980 to 2010. However, Beijing was and will be facing great challenges in energy supply with a whopping energy consumption-production gap of more than 90%. Therefore, Beijing is pressed for one of the leaders in action to address energy conservation and carbon mitigation. In a sense, this case study not only verify the applicability and comparability of the analytical framework and accounting system, highlight the analysis on carbon-based energy transfer, but provide guidelines for other cities’ low-carbon development to cope with the internal demands on CO2 reduction.
Beijing has a jurisdiction over 14 municipal districts and 2 counties. Two types of city boundaries, recognized as the ‘city administrative area’ and the ‘city districts’ (Cai et al., 2014), are distinguished to define the geographical boundary of the study area in line with the statistical yearbooks. The city administrative area encompasses all municipal districts, county-level cities and counties but each city district covers only the corresponding municipal district. The socio-economic data and energy consumption data of ‘city districts’ and ‘city administrative area’ were mainly obtained from China City Statistical Yearbook 2011, China Energy Yearbook 2011, and Beijing Statistical Yearbook 2011. The economic input-output data in 2010 were issued by Beijing Statistics Bureau and could be downloaded from website regarded as Beijing input-output survey. Data processing procedures are based on the methods presented in Table 1. The energy use indicators are evaluated by statistics, obtained by field interview or mining from government data and previous studies (Zhao, 2009). It is important to note that both the transportation and the residential sector account the energy-induced CO2 emissions associated with residential travel in the typical sector based methods. In order to avoid duplicating accounting, the total energy use and CO2 emissions were excluded from the energy consumption and carbon emissions for energy production sectors. The results could be seen in Tables 2 and 3.

4.2 Results analysis

Table 2 presents results showing the amount of each carbon-based energy metabolic process, including the input, the transformation, the transfer and the discharge of carbon-based energy by both the GBM and the G+BM methods. Due to data restriction, the results merely demonstrate the process of carbon-based energy metabolism in city administrative area. The results for the input in Table 2 exhibit a carbon-based energy consumer for the urban complex ecosystem in Beijing. The local supply of carbon-based energy (i.e. the local input) is smaller than the total supply (i.e. the total input), and the non-local supply of carbon-based energy (i.e. the non-local input) is almost half of the total input. Therefore, Beijing is deemed to be dependent on the carbon-based energy supply from its supporting area. In some sense, Beijing takes resources from its hinterland. Tables 2 and 3 present the transfer of carbon-based energy or the energy use in detail. In total, the difference is enhanced when considering the transboundary infrastructure, the industrial linkage and international and inter-regional trade. The calculations of the total transfers or energy use are with different results by the three kinds of methods.
As for Table 2, various data of different statistical criterion demonstrate a similar result. Without considering the heat loss in the metabolism process, the results for the total energy consumption is close to the results for the final energy consumption. In fact, there is only a little difference for the accounting results from the two different sources of statistical data. And the accounting results of city district do not have a significant distinction from the results of city administrative area when assessing the transfer of carbon-based energy in Beijing by the GBM and the G+BM methods. The amount of energy transfer or energy use in city districts shares a proportion of nearly 90% of the total final energy use in city administrative area. The main reason is that city districts are not actually the urban area, and it is composed by a number of rural areas due to the specificity of administrative division in China.
Table 3 explicitly exhibits the carbon-based energy use of socio-economic activities and urban key materials within footprint area in terms of production, consumption, investment and trading. Particularly, the transfer of urban key materials is critical to the the G+BM methods. These items should be seriously reckoned with, because the total transfer of urban key materials approximately occupies 60% of the total transfer within the city boundaries by the GMB methods. This result is comparable to the result published by Hillman et al. (2004). As for the direct and indirect energy use shown in Table 3, the direct energy use is three times less than the complete energy use. Both the direct and complete energy use of carbon-based energy processing industries ranks first in all industries. These kinds of industries are resource-dependent industries, embarking on energy processing and production and mineral exploitation, such as processing of petroleum, coking, processing of nuclear fuel, production and distribution of electricity and heat. The complete energy use of transportation and the energy use accompanied with international trade rank a lot higher than most industries, only lower than metal mining and production and distribution of electric power and heat power. So, in a sense, the urban openness probably accelerated the linkage of socio-economic activities between cities and the hinterland. The energy use associated with import from foreign countries and other domestic regions is similar except for the manufacturing industry. This phenomenon reveals similar pressure on environmental resources in both the other domestic regions and the global regions.
Table 2 Calculations of carbon-based energy metabolism by GBM and G+BM in Beijing
Metabolic process Input (104 tce) Transformation
(104 tce)
Transfer
(104 tce)
CO2 emissions
(104 t)
Local input Nonlocal input
Total metabolism 3938 3016 3457 4835b 10955
The transfer through various accounting methods (104 tce)
Geographical boundary based methods Geographical boundary +
based method
City type based method Sector/fuel
based method
Typical sector based method
Residential
sector
Transportation
sector
City districts 4728b 4728 a, b 1462a; 1398b 724a 7460
City administrative area 4799b 4735a; 4835b; 5272c 1964a 1335a 7908

a. Data originated from ‘total energy consumption’; b. Data originated from ‘final energy consumption’;c. Data originated from ‘energy balance sheet’

Table 3 Calculations of carbon-based energy use by EIO-LCA method in Beijing
Direct energy use Complete energy use Energy use from rural resident Energy use from urban
resident
Energy
use from investment
Energy use from
export
Energy
use from foreign import
Energy use from domestic import
The energy use of socio-economic activities by footprint based methods (104 tce)
Carbon-based energy mining 29 726 3 37 51 614 488 209
Carbon-based energy processing 1375 4812 57 671 848 2784 1158 2280
Metals mining 437 4276 20 270 989 2812 1244 2596
Agriculture 49 199 6 83 23 68 52 97
Manufacturing 472 2339 21 292 609 1246 315 1550
Construction 92 139 0 6 76 53 10 37
Transportation 928 4226 38 488 699 2654 1543 1756
Commerce 644 1069 16 168 219 488 164 262
The energy use of urban key materials (104 tce)
Fuel 1403 5538 60 708 899 756 2643 1645
Food 57 156 4 53 15 79 20 79
Cement 164 578 3 39 210 291 58 356
Water 2 4 1 1 1 2 1 1

Note: Carbon-based energy mining contains mining and washing of coal, extraction of petroleum and natural gas. Carbon-based energy processing contains processing of petroleum, coking, processing of nuclear fuel, production and distribution of electric power and heat power, production and distribution of gas. Agriculture contains farming, forestry, animal husbandry and fishery. Manufacturing contains all the secondary industry except for carbon-based energy mining and processing, metals mining and construction. Commerce contains all the tertiary industrial sectors except for transportation. Fuel is corresponding to most items of carbon-based energy mining and processing. Food is corresponding to all the items of food manufacturing industries. Cement is corresponding to part items of nonmetal mineral manufacturing industries. Water is corresponding to most items of production and distribution of water.

5 Conclusions and implications

This paper presented a comprehensive analytical framework to illustrate the process of carbon-based energy flow metabolism in cities, and arranged a set of methods into three categories to assess energy use and CO2 emissions. In order to test and verify the applicability and comparability of these methods, Beijing was documented to be a representative to reveal the metabolic characteristics. The research has revealed several important theoretical, methodological and operational issues.
Theoretically, urban metabolism of carbon-based energy provides an integrated analytical framework to illuminate the process and structure of energy-induced CO2 emissions within diverse geographical boundaries. The urban metabolic process of carbon-based energy uncover the natural supply, resource loading and environmental influence accompanied by socioeconomic development in urban complex ecosystems, including the input, transformation, transfer and discharge of carbon based energy. Among them, the transfer of carbon-based metabolism is the strongest linkage between socio-economic subsystems and natural subsystems and is also essential to assess urban energy use and CO2 emissions. The three kinds of geographical boundaries distinctively illustrate the accounting characteristics of urban energy use and CO2 emissions, with an emphasis on the influence of sectoral structure, industrial supply chains and critical transboundary infrastructure supply respectively. Four different scopes clearly outline the accounting items. Relating the scopes with different geographical boundaries gives great insights to the formulation of policies on the assignment of emission reduction responsibility.
Methodologically, each kind of methods has its distinct strength and weakness to assess urban energy use and CO2 emissions. The research should be conducted in line with the data availability and practical circumstances to enhance the applicability and comparability among analytical results. In this regard, the accounting methods based on city types and sector/fuel types are easy to operate with a proximity to raw data, but the policy implication seems neither concrete nor explicit. The accounting methods based on spatial data can describe the spatial pattern and structure of energy use and CO2 emissions perfectly, while the absence of readily available data tends to preclude the extensive application. The accounting methods based on EIO, LCA and/or hybrid EIO-LCA models explicitly indicate the change in energy use and CO2 emissions posed by final demand change. However, the data preparation would cost a good amount of time and money, and in some ways, the downscaling urban IO table from regional or national lever increases uncertainty. The EMA and MFA methods have advantages to depict the structure, process and efficiency of urban ecosystems, yet both methods are weak in formulating policies to implement them effectively. The geographical boundary plus based methods are conductive to perfect carbon emissions inventories in accordance with urban functional department, and the concrete accounting items cross the city boundaries, such as the urban key materials alike, requires further consideration.
With regards to the illustrative case study, the carbon-based energy metabolism of Beijing, just as other cities in China, is a kind of urban and regional carbon-based energy metabolism in essence. The application of three kinds of accounting methods has illustrated the urban metabolic characteristics from various perspectives. The geographical boundary based methods pay close attention to the response of energy use and CO2 emissions to the change in various sectors in socio-economic subsystems. The footprint based methods lay stress on the change in energy use caused by the change in industrial linkage, residential lifestyle, as well as inter-regional and international commercial intercourse. The geographical boundary plus based methods underline energy use and CO2 emissions as a result of the transboundary infrastructure operation. Therefore, the combination of the three kinds of methods could comprehensively explore the evolutionary trajectory and the development path of urban energy use and CO2 emissions, offer great insight into the adjustment of the urban economic and energy structure and the final consumption structure, and instruct the urban infrastructure planning to curb urban energy use and CO2 emissions at multi-scales.
From the presented work, we conclude that carbon reduction should be a shared responsibility, and that the carbon reduction responsibility can be assigned in the light of production, consumption and shared responsibility based principles. The accounting methods based on geographical boundaries assess the carbon-based energy metabolism within the city boundary, occurring along with industries production and peoples’ livelihood. So the carbon reduction responsibility could be assigned by the production based principles, or in accordance with the socio-economic activities generating site. The footprint based accounting methods estimate the carbon-based energy metabolism associated with final consumption of goods and services. As a result, the carbon reduction responsibility could be assigned in proportion to the metabolism occurring in the process of manufacturing and transport of goods and services. However, the production based assignment principle might underestimate the carbon emissions during the consumption of goods and services, hide the carbon emission shifted to other cities and regions, and then bring about the ‘carbon leakage’. The consumption based assignment principle is weak to govern the final consumption behavior beyond the city boundaries. For example, in some highly industrialized cities the production is more than the consumption, but these cities tend to benefit from economic income and revenue. In these cases, the production- or the consumption-based assignment principle ignores the carbon reduction responsibility which the cities should take in the progress of industrialization. Hence, the assignment of carbon reduction responsibility should comply with the shared responsibility principle to remedy the limitations in the former principles.
The greatest contribution of this paper is the connection of carbon-based energy utilization with socio-economic metabolic mechanism in term of urban carbon-based energy metabolism. The three kinds of accounting methods based on socio-economic activity boundaries rather than emission boundaries comprehensively assess the intensity of carbon-based energy use and the associated level of CO2 emissions in a complementary way. Nevertheless, in the context of lack of solid theoretical foundation for urban carbon-based metabolism study, as a critical part of intersection among the economics of climate change, urban ecology, urban geography and so on, the structure and function, the evolutionary pattern and mechanism, the forecast and regulation of urban carbon -based energy metabolism require thoroughly probing into. In particular, the response of carbon-based energy use and CO2 emissions to the change in socio-economic and spatial structures is a fundamental issue worth further research. These structures include the industrial structure (or the output structure, which is generally conceived as the industrial structure), the preliminary input structure, the intermediate input structure, and so on, as well as the residential consumption pattern, the technical mode and urban spatial pattern.

The authors have declared that no competing interests exist.

1
Agostinho F, Pereira L, 2013. Support area as an indicator of environmental load: Comparison between Embodied Energy, Ecological Footprint, and Emergy Accounting methods.Ecological Indicators, 24(1): 494-503.

2
Cai B F, Zhang L X, 2014. Urban CO2 emissions in China: Spatial boundary and performance comparison. Energy Policy, Online.

3
Chavez A, Ramaswami A, 2013. Articulating a trans-boundary infrastructure supply chain greenhouse gas emission footprint for cities: Mathematical relationships and policy relevance.Energy Policy, 54(3): 376-384.

4
Cheng V, Steemers K, 2011. Modelling domestic energy consumption at district scale: A tool to support national and local energy policies.Environmental Modelling & Software, 26(10): 1186-1198.

5
Codoban N, Kennedy C A, 2008. Metabolism of neighborhoods.Journal of Urban Planning and Development, 134(1): 21-31.

6
Decker E H, Elliott S, Smith F Aet al., 2000. Energy and material flow through the urban ecosystem.Annual Review of Energy and the Environment, 25(1): 685-740.

7
Dhakal S, 2009. Urban energy us e and carbon emissions from cities in China and policy implications.Energy Policy, 37(11): 4208-4219.

8
Feng Y Y, Chen S Q, Zhang L X, 2013. System dynamics modeling for urban energy consumption and CO2 emissions: A case study of Beijing, China.Ecological Modelling, 252(10): 44-52.

9
Green Design Institute (GDI). Economic input-output life cycle assessment (EIO-LCA). Carnegie Mellon University, 2008,

10
Gurney K R, Razlivanov I, Song Yet al., 2012. Quantification of fossil fuel CO2 emissions on the building/street scale for a large US City.Environmental science & technology, 46(21): 12194-12202.

11
Hertwich E G, 2005. Life cycle approaches to sustainable consumption: a critical review.Environmental science & technology, 39(13): 4673-4684.

12
Hillman T, Ramaswami A, 2010. GHG emission footprints and energy use benchmarks for eight US cities.Environment Science & Technology, 44(6): 1902-1910.

13
IPCC, 2006. 2006 IPCC guidelines for national greenhouse gas inventories. In: Eggleston H S, Buendia L, Miwa Ket al., Prepared by the National Greenhouse Gas Inventories Programme. Japan, IGES.

14
Kennedy C, Cuddihy J, Engel-Yan J, 2007. The changing metabolism of cities.Journal of Industrial Ecology, 11(2): 43-59.

15
Kennedy C, Steinberger J, Gasson Bet al., 2010. Methodology for inventorying greenhouse gas emissions from global cities.Energy Policy, 38(9): 4828-4837.

16
Kennedy S, Sgouridis S, 2011. Rigorous classification and carbon accounting principles for low and Zero Carbon Cities.Energy Policy, 39(9): 5259-5268.

17
Kort E A, Frankenberg C, Miller C Eet al., 2012. Space-based observations of megacity carbon dioxide.Geophysical Research Letters, 39(17): 1-5.

18
Lazarus M, Chandler C, Erickson P, 2013. A core framework and scenario for deep GHG reductions at the city scale.Energy Policy, 57(6): 563-574.

19
Lin J Y, Liu Y, Meng F Xet al., 2013. Using hybrid method to evaluate carbon footprint of Xiamen City, China.Energy Policy, 58(7): 220-227.

20
Liu G, Yang Z, Chen Bet al., 2014. Emergy-based dynamic mechanisms of urban development, resource consumption and environmental impacts.Ecological Modelling, 271(1): 90-102.

21
Marcotullio P J, Sarzynski A, Albrecht Jet al., 2013. The geography of global urban greenhouse gas emissions: An exploratory analysis.Climatic Change, 121(4): 621-634.

22
Matthews H S, Hendrickson C T, Weber C L, 2008. The importance of carbon footprint estimation boundaries.Environment Science & Technology, 42(16): 5839-5842.

23
Minx J, Baiocchi G, Wiedmann Tet al., 2013. Carbon footprints of cities and other human settlements in the UK.Environmental Research Letters, 8(3): 35-39.

24
Onat N C, Kucukvar M, Tatari O, 2014. Scope-based carbon footprint analysis of U.S. residential and commercial buildings: An input-output hybrid life cycle assessment approach.Building and Environment, 72: 53-62.

25
Parshall L, Gurney K, Hammer S Aet al., 2010. Modeling energy consumption and CO2 emissions at the urban scale: Methodological challenges and insights from the United States.Energy Policy, 38(9): 4765-4782.

26
Pincetl S, Bunje P, Holmes T, 2012. An expanded urban metabolism method: Toward a systems approach for assessing urban energy processes and causes.Landscape and Urban Planning, 107(3): 193-202.

27
Ramaswami A, Chavez A, Chertow M, 2012. Carbon footprinting of cities and implications for analysis of urban material and energy flows.Journal of Industrial Ecology, 16(6): 783-785.

28
Ramaswami A, Chavez A, Ewing-Thiel Jet al., 2011. Two approaches to greenhouse gas emissions foot-printing at the city scale.Environment Science & Technology, 45(10): 4205-4206.

29
Wang H K, Fu L X, Zhou Yet al., 2010. Trends in vehicular emissions in China’s mega cities from 1995 to 2005.Environmental Pollution, 158(2): 394-400.

30
While A, Jonas A E G, Gibbs D, 2010. From sustainable development to carbon control: Eco-state restructuring and the politics of urban and regional development.Transactions of the Institute of British Geographers, 35(1): 76-93.

31
Wolman A, 1965. The metabolism of the city.Scientific American, 213(6): 179-190.

32
Zhao M, Zhang W G, Yu L Z, 2009. Resident travel modes and CO2 emissions by traffic in Shanghai City.Research of Environmental Sciences, 22(6): 747-752. (in Chinese)

33
Zheng S, Wang R, Glaeser E Let al., 2011. The greenness of China: household carbon dioxide emissions and urban development.Journal of Economic Geography, 11(5): 761-792.

Outlines

/