
Journal of Geographical Sciences >
Grassland coverage inter-annual variation and its coupling relation with hydrothermal factors in China during 1982-2010
*Corresponding author: Li Jianlong, Professor, E-mail: jianlongli@gmail.com, jlli2008@nju.edu.cn
Author: Zhou Wei (1985-), PhD, specialized in application of remote sensing and terrestrial ecosystem carbon cycle. E-mail: zhouw866@163.com
Received date: 2013-12-27
Accepted date: 2014-01-22
Online published: 2014-04-20
Supported by
The National Natural Science Foundation of China, No.41271361.National Basic Research Program of China, No.2010CB950702.The APN Projects, No.ARCP2013-16NMY-Li.The Public Sector Linkages Program supported by AusAID, No.64828.China’s High-tech Special Projects, No.2007AA10Z231
Copyright
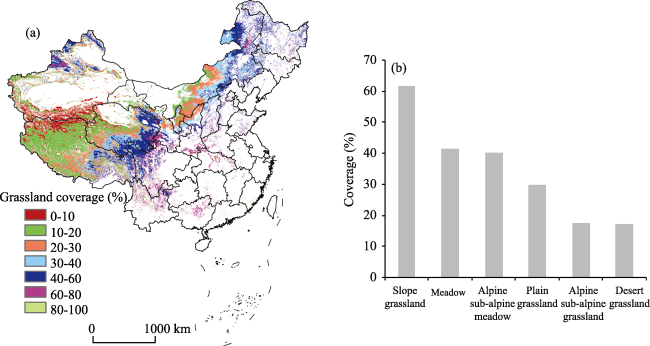
GIMMS (Global Inventory Modeling and Mapping Studies) NDVI (Normalised Difference Vegetation Index) from 1982 to 2006 and MODIS (Moderate Resolution Imaging Spectroradiometer) NDVI from 2001 to 2010 were blended to extract the grass coverage and analyze its spatial pattern. The response of grass coverage to climatic variations at annual and monthly time scales was analyzed. Grass coverage distribution had increased from northwest to southeast across China. During 1982-2010, the mean nationwide grass coverage was 34% but exhibited apparent spatial heterogeneity, being the highest (61.4%) in slope grasslands and the lowest (17.1%) in desert grasslands. There was a slight increase of the grass coverage with a rate of 0.17% per year. Increase in slope grasslands coverage was as high as 0.27% per year, while in the plain grasslands and meadows the grass coverage increase was the lowest (being 0.11% per year and 0.1% per year, respectively). Across China, the grass coverage with extremely significant increase (P<0.01) and significant increase (P<0.05) accounted for 46.03% and 11% of the total grassland area, respectively, while those with extremely significant and significant decrease accounted for only 4.1% and 3.24%, respectively. At the annual time scale, there are no significant correlations between grass coverage and annual mean temperature and precipitation. However, the grass coverage was somewhat affected by temperature in alpine and sub-alpine grassland, alpine and sub-alpine meadow, slope grassland and meadow, while grass coverage in desert grassland and plain grassland was more affected by precipitation. At the monthly time-scale, there are significant correlations between grass coverage with both temperature and precipitation, indicating that the grass coverage is more affected by seasonal fluctuations of hydrothermal conditions. Additionally, there is one-month time lag-effect between grass coverage and climate factors for each grassland types.
ZHOU Wei , GANG Chengcheng , CHEN Yizhao , MU Shaojie , SUN Zhengguo , LI Jianlong . Grassland coverage inter-annual variation and its coupling relation with hydrothermal factors in China during 1982-2010[J]. Journal of Geographical Sciences, 2014 , 24(4) : 593 -611 . DOI: 10.1007/s11442-014-1108-0
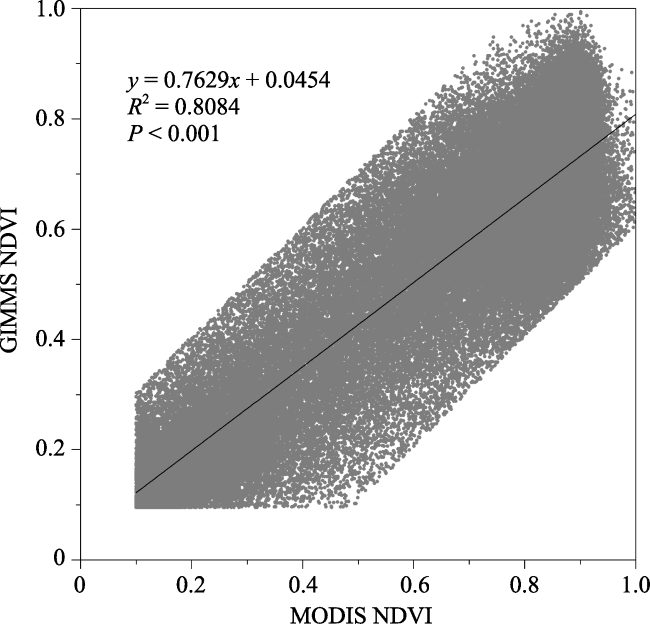
Figure 1 The regression analysis between MODIS NDVI and GIMMS NDVI |
Table 1 Error analysis for the interpolated meteorological data, using year 2001 as an example |
| Month | Temperature (℃) (n=720) | Precipitation (mm) (n=720) | |||||
|---|---|---|---|---|---|---|---|
| Mean error | RMSE | R2 | Mean error | RMSE | R2 | ||
| Jan | 0.006 | 0.958 | 0.958 | 0.289 | 0.987 | 0.809 | |
| Feb | -0.073 | 0.985 | 0.935 | 0.351 | 1.425 | 0.815 | |
| Mar | -0.115 | 0.937 | 0.859 | 0.509 | 0.958 | 0.931 | |
| Apr | -0.136 | 0.883 | 0.821 | 3.149 | 1.491 | 0.799 | |
| May | -0.124 | 0.925 | 0.842 | 0.438 | 1.677 | 0.839 | |
| Jun | -0.108 | 0.960 | 0.869 | 1.758 | 0.975 | 0.877 | |
| Jul | -0.113 | 0.883 | 0.894 | -10.026 | 1.709 | 0.841 | |
| Aug | -0.095 | 0.908 | 0.886 | -7.659 | 1.506 | 0.792 | |
| Sep | -0.098 | 0.976 | 0.893 | -4.742 | 0.997 | 0.828 | |
| Oct | -0.085 | 0.950 | 0.897 | 2.768 | 1.302 | 0.817 | |
| Nov | 0.028 | 0.875 | 0.927 | 0.481 | 1.146 | 0.784 | |
| Dec | 0.008 | 0.887 | 0.953 | -0.447 | 1.030 | 0.803 | |
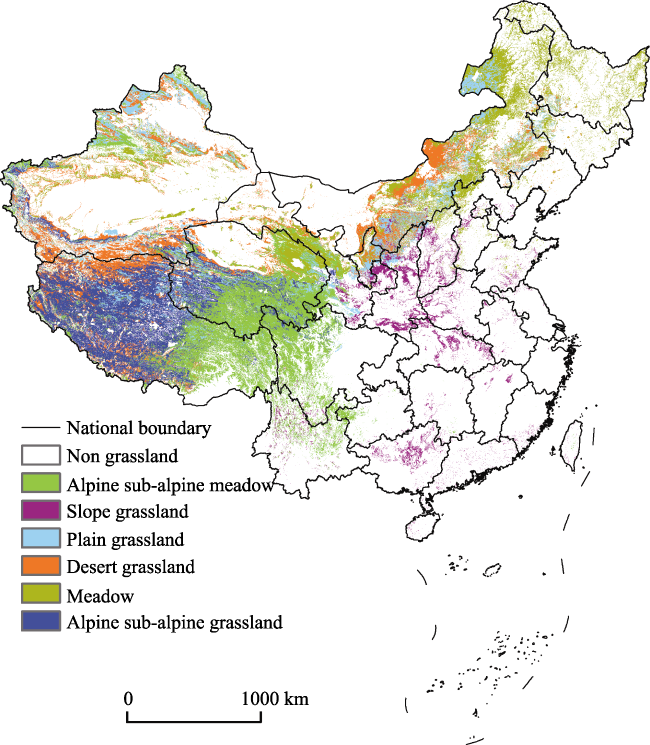
Figure 2 Location of the study area and its grassland type distribution |
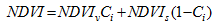
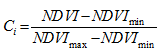
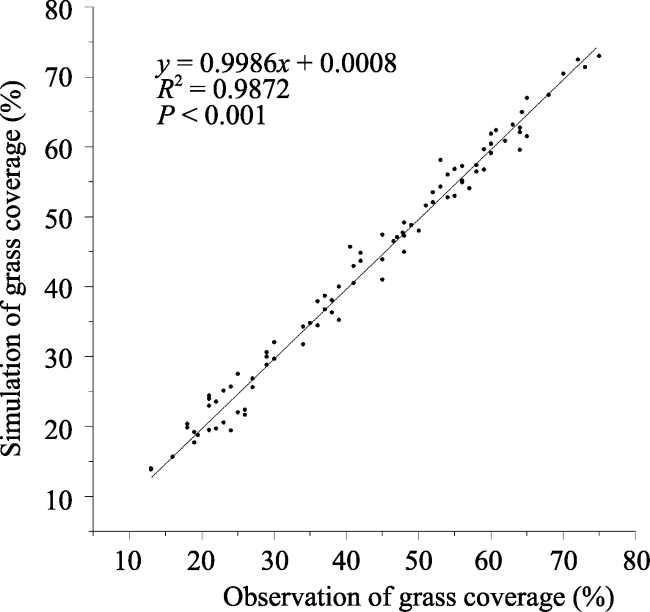
Figure 3 Correlation analysis of the estimated grass coverage and its field observed values |

 is the regression sum of squares,
 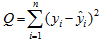 is residual sum of squares; yi is the estimated value of vegetation coverage for year i and
  is the regression value;
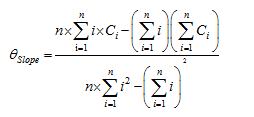
  is the average value of annual vegetation coverage from 1982 to 2010; n is the sample size (here, n = 29). According to the F-test, the changing tendency was classified into 6 categories: extremely significant decrease (ESD, θSlope<0, P<0.01); significant decrease (SD, θSlope <0, 0.01<P<0.05); no significant decrease (NSD, θSlope<0, P>0.05); no significant increase (NSI, θSlope >0, P>0.05); significant increase (SI, θSlope >0, 0.01<P<0.05); extremely significant increase (ESI, θSlope >0, P<0.01).
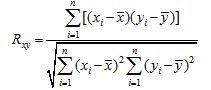
Figure 4 Spatial distribution of the mean grass coverage from 1982 to 2010 in China |
Table 2 Results of implementation of the grass coverage change significant test for different grassland types |
| Percentage (%) | Alpine sub-alpine meadow | Slope grassland | Plain grassland | Desert grassland | Meadow | Alpine sub-alpine grassland | Total grassland |
|---|---|---|---|---|---|---|---|
| ESD | 5.53 | 1.64 | 5.26 | 2.76 | 6.27 | 1.22 | 4.10 |
| SD | 4.05 | 1.68 | 3.75 | 2.35 | 5.30 | 1.12 | 3.24 |
| NSD | 13.84 | 8.23 | 17.61 | 10.85 | 23.78 | 6.47 | 13.80 |
| NSI | 19.90 | 18.46 | 23.96 | 22.69 | 27.13 | 18.72 | 21.83 |
| SI | 9.85 | 11.63 | 9.55 | 11.97 | 8.35 | 15.02 | 11.00 |
| ESI | 46.83 | 58.36 | 39.87 | 49.39 | 29.17 | 57.46 | 46.03 |
Note: ESD is the abbreviation of extremely significant decrease, SD is significant decrease, NSD is non-significant decrease, NSI is non-significant increase, SI is significant increase, and ESI is extremely significant increase. |
Figure 5 Dynamics of the China’s grassland coverage from 1982 to 2010. Pattern of the grass coverage change (a), spatial distribution of significant test in China (b), the grade percentage of significant change of different types of grass coverage (c), and the nationwide inter-annual change of grass coverage (d) |
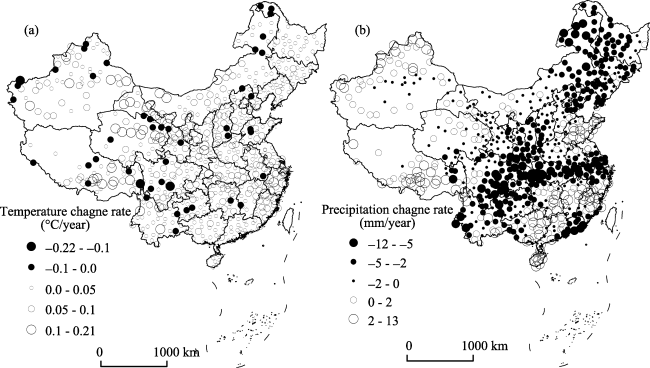
Figure 6 Changing trends of annual mean temperature and total precipitation in China from 1982 to 2010 |
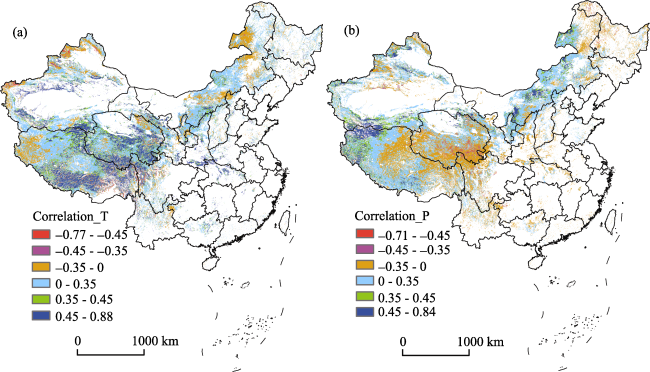
Figure 7 Correlations of grass coverage in China with temperature (a), and precipitation (b) from 1982 to 2010 |
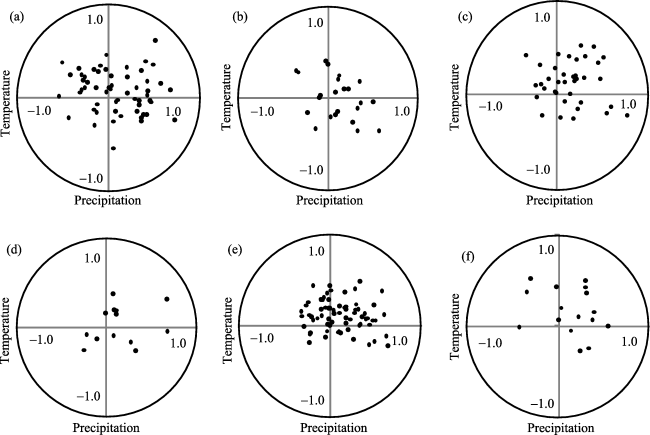
Figure 8 Distribution of correlation coefficient of temperature, precipitation and grassland coverage of different grassland types (a. denotes alpine and sub-alpine meadow; b. denotes slope grassland; c. denotes plain grassland; d. denotes desert grassland; e. denotes meadow; f. denotes alpine and sub-alpine grassland) |
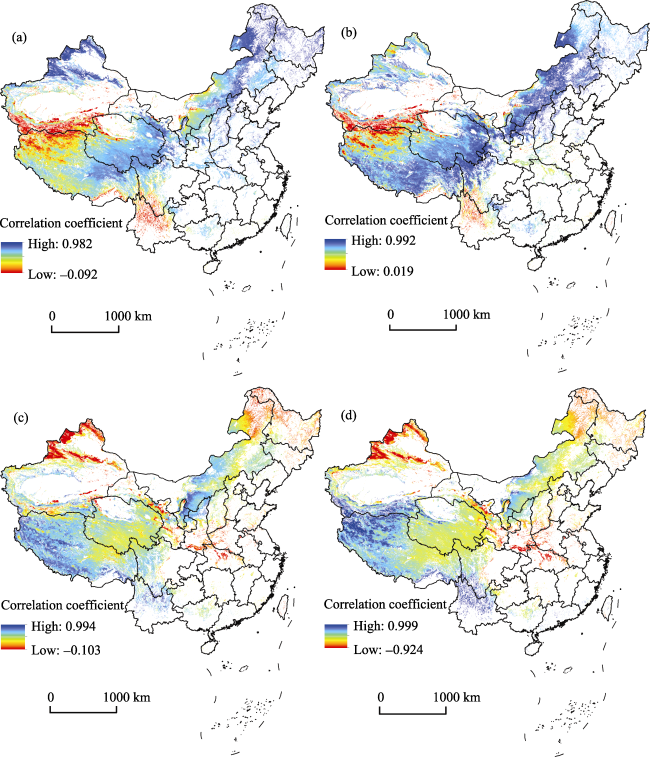
Figure 9 Correlation coefficients between current month’s grass coverage and the current month’s temperature (a), the former one month’s temperature (b), the former two months’ temperature (c), and the former three months’ temperature (d) |
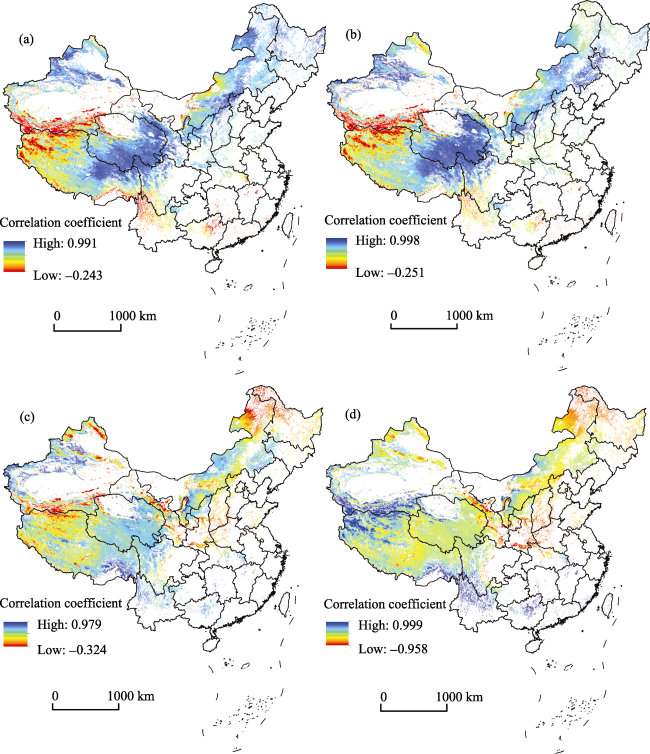
Figure 10 Correlation coefficients between current month’s grass coverage and the current month’s precipitation (a), the former one month’s precipitation (b), the former two months’ precipitation (c), and the former three months’ precipitation (d) |
Figure 11 Correlation coefficients between current months’ grass coverage for different grassland types and the current month’s, former one month’s, former two months’ and former three months’ temperature (a) and precipitation (b) |
Table 3 Correlation coefficients between current month’s grass coverage for different grassland types and the current month’s, former one month’s, former two months’ and former three months’ temperature |
| Temperature | Current month’s | Former one month’s | Former two months’ | Former three months’ |
|---|---|---|---|---|
| Alpine sub-alpine meadow | 0.82 | 0.92 | 0.74 | 0.28 |
| Slope grassland | 0.83 | 0.90 | 0.68 | 0.07 |
| Plain grassland | 0.83 | 0.91 | 0.71 | 0.20 |
| Desert grassland | 0.71 | 0.85 | 0.75 | 0.42 |
| Meadow | 0.88 | 0.93 | 0.68 | 0.11 |
| Alpine sub-alpine grassland | 0.76 | 0.90 | 0.81 | 0.47 |
| Total grassland | 0.80 | 0.90 | 0.74 | 0.29 |
Table 4 Correlation coefficients between current month’s grass coverage for different grassland types and the current month’s, former one month’s, former two months’ and former three months’ precipitation |
| Precipitation | Current month’s | Former one month’s | Former two months’ | Former three months’ |
|---|---|---|---|---|
| Alpine sub-alpine meadow | 0.81 | 0.85 | 0.49 | 0.11 |
| Slope grassland | 0.71 | 0.74 | 0.61 | 0.06 |
| Plain grassland | 0.80 | 0.82 | 0.53 | 0.04 |
| Desert grassland | 0.64 | 0.69 | 0.55 | 0.03 |
| Meadow | 0.84 | 0.83 | 0.54 | 0.19 |
| Alpine sub-alpine grassland | 0.70 | 0.75 | 0.51 | 0.15 |
| Total grassland | 0.76 | 0.79 | 0.56 | 0.07 |
The authors have declared that no competing interests exist.
| 1 |
|
| 2 |
|
| 3 |
|
| 4 |
|
| 5 |
|
| 6 |
|
| 7 |
|
| 8 |
|
| 9 |
|
| 10 |
|
| 11 |
|
| 12 |
|
| 13 |
|
| 14 |
|
| 15 |
|
| 16 |
|
| 17 |
|
| 18 |
|
| 19 |
|
| 20 |
|
| 21 |
|
| 22 |
|
| 23 |
|
| 24 |
|
| 25 |
|
| 26 |
|
| 27 |
|
| 28 |
|
| 29 |
|
| 30 |
|
| 31 |
|
| 32 |
|
| 33 |
|
| 34 |
|
| 35 |
|
| 36 |
|
| 37 |
|
| 38 |
|
| 39 |
|
| 40 |
|
| 41 |
|
| 42 |
|
| 43 |
|
| 44 |
|
| 45 |
|
| 46 |
|
/
| 〈 |
|
〉 |

