
Journal of Geographical Sciences >
Estimation of diffuse photosynthetically active radiation and the spatiotemporal variation analysis in China from 1981 to 2010
*Corresponding author: Zhang Li (1982-), E-mail: li.zhang@igsnrr.ac.cn
Author: Ren Xiaoli (1984-), PhD, E-mail: xlren_lydia@hotmail.com
Received date: 2013-12-20
Accepted date: 2014-01-27
Online published: 2014-04-20
Supported by
Research on the key technology of effectiveness evaluation and standardized construction of National Nature Reserve, No.201209028.“Strategic Priority Research Program-Climate Change: Carbon Budget and Relevant Issues” of the Chinese Academy of Sciences, No.XDA05050600.Key Projects in the National Science & Technology Pillar Program during the Twelve Five-year Plan Period, No.2013BAC03B03
Copyright
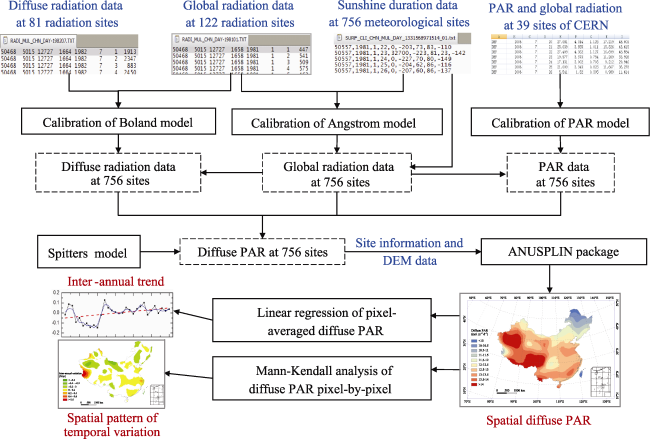
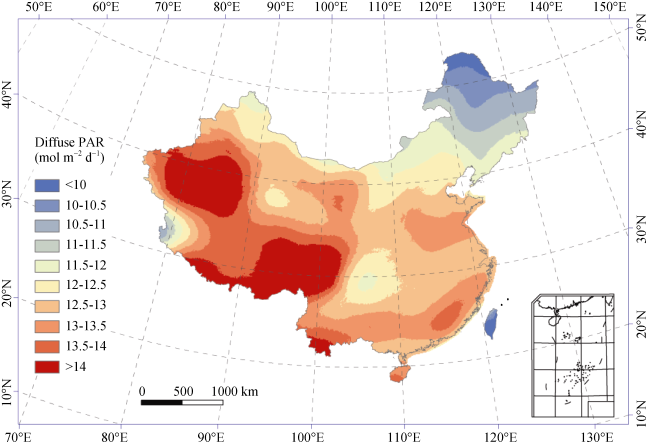
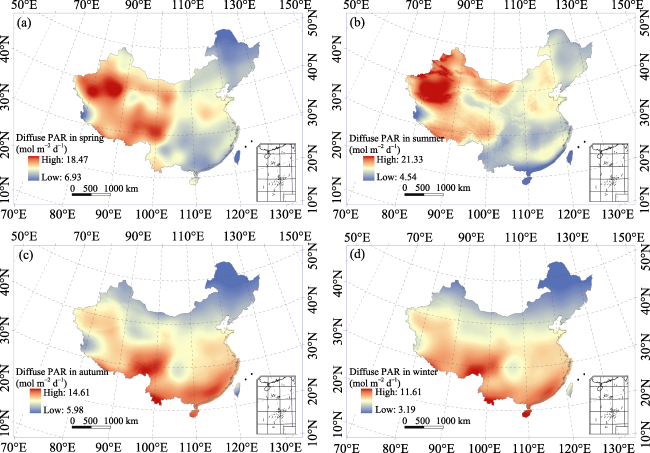
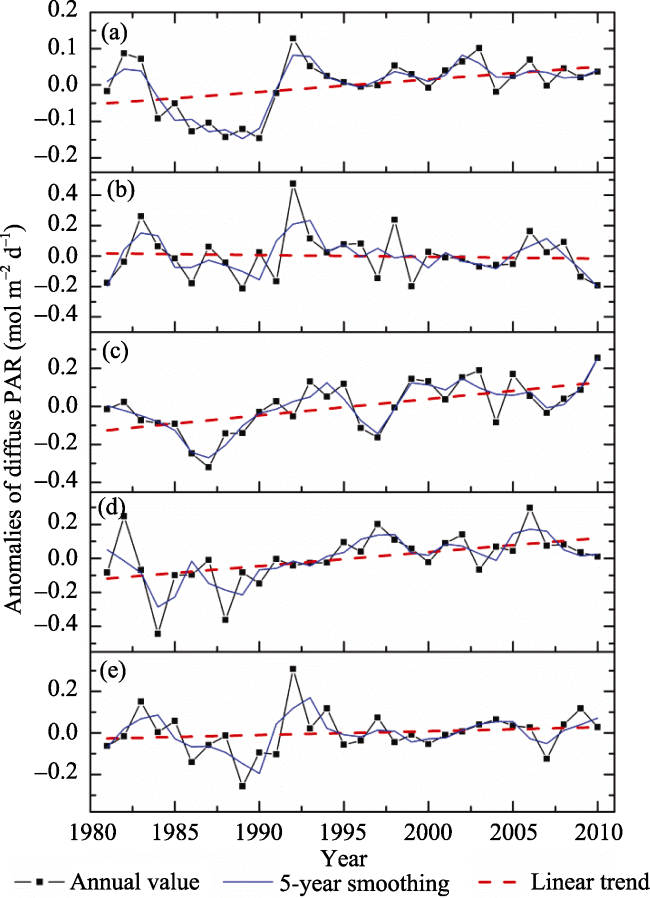
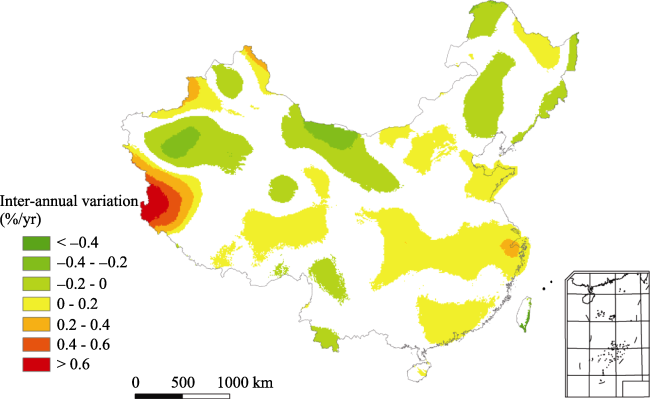
Photosynthetically active radiation (PAR) is the energy source of plant photosynthesis, and the diffuse component can enhance canopy light use efficiency, thereby increasing the carbon uptake. Therefore, diffuse PAR is an important driving factor of ecosystem productivity models. In this study, we estimated the diffuse PAR of over 700 meteorological sites in China from 1981 to 2010 using an empirical model based on observational data from Chinese Ecosystem Research Network (CERN) and China Meteorology Administration. Then we derived the spatial data set of 10 km monthly diffuse PAR using ANUSPLIN software, and analyzed the spatiotemporal variation characteristics of diffuse PAR through GIS and trend analysis techniques. The results showed that: (1) The spatial patterns of annual average diffuse PAR during 1981-2010 are heterogeneous across China, lower in the northeast and higher in the west and south. The nationwide average value for 30 years ranges from 6.66 mol m-2 d-1 to 15.27 mol m-2 d-1, and the value in summer is the biggest while the value in winter is the smallest. (2) There is an evident increasing trend of annual diffuse PAR during recent 30 years, with the increasing amplitude at 0.03 mol m-2 d-1/10a. But a significant declining trend is shown in the first 10 years, and obvious anomalies can be seen in 1982, 1983, 1991 and 1992. And there is a downtrend in spring and an uptrend in all the other seasons. (3) The spatial distribution of temporal variation rates of diffuse PAR is inhomogeneous across the country, generally decreasing in the north and increasing in the south.
REN Xiaoli , HE Honglin , ZHANG Li , YU Guirui . Estimation of diffuse photosynthetically active radiation and the spatiotemporal variation analysis in China from 1981 to 2010[J]. Journal of Geographical Sciences, 2014 , 24(4) : 579 -592 . DOI: 10.1007/s11442-014-1107-1
Figure 1 The flowchart of the estimation and spatiotemporal variation analysis of diffuse PAR (the blue font represents the original data, dashed boxes represent the intermediate results, the red font represents the final results, and the solid boxes represent models and methods) |
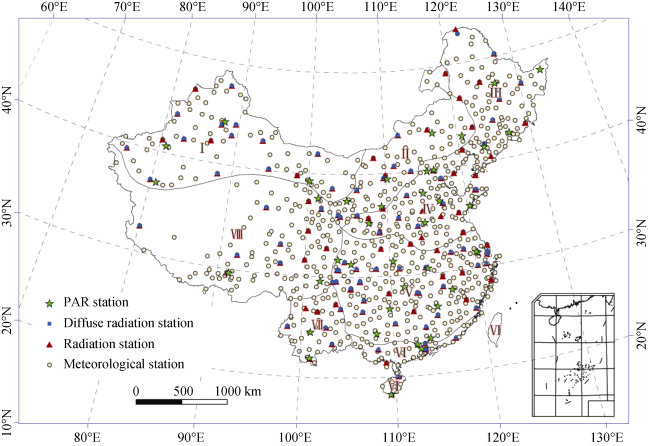
Figure 2 Distribution of meteorological stations, radiation stations and CERN stations (I. Northwest China; II. Inner Mongolia; III. Northeast China; IV. North China; V. Central China; VI. South China; VII. Southwest China; VIII. Qinghai-Tibet Plateau) |
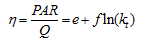
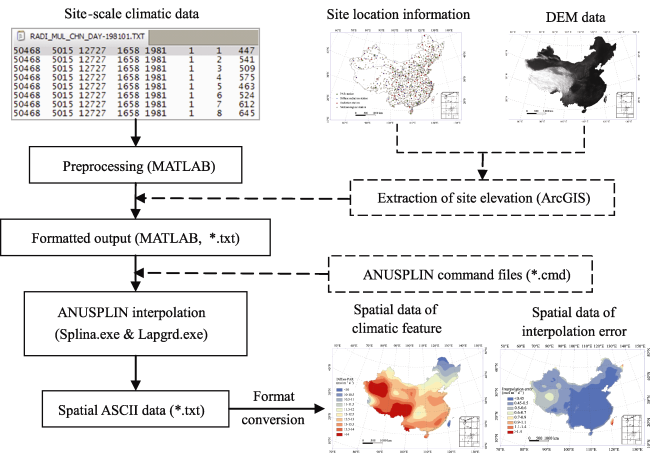
Figure 3 The flowchart of the spatialization of diffuse PAR using ANUSPLIN software |
Table 1 The results of the calibration and validation of PAR model in different regions across China |
| Estimated values and validation of parameters | Northwest China | Inner Mongolia | Northeast China | North China | Central China | South China | Southwest China | Qinghai-Tibet Plateau |
|---|---|---|---|---|---|---|---|---|
| e | 0.39 | 0.38 | 0.35 | 0.35 | 0.36 | 0.38 | 0.36 | 0.40 |
| f | -0.06 | -0.06 | -0.06 | -0.07 | -0.07 | -0.02 | -0.04 | -0.03 |
| Site expansion-R | 0.99 | 0.99 | 0.97 | 0.98 | 0.98 | 0.98 | 0.92 | 0.98 |
| Site expansion- RMSE(mol m-2 d-1) | 2.29 | 2.49 | 3.41 | 2.96 | 2.89 | 3.29 | 4.15 | 2.58 |
| Time expansion-R | 0.99 | 0.99 | 0.97 | 0.98 | 0.98 | 0.99 | 0.97 | 0.99 |
| Time expansion- RMSE (mol m-2 d-1) | 2.15 | 2.31 | 3.17 | 2.83 | 2.85 | 2.76 | 3.54 | 2.40 |
Figure 4 Spatial distribution of perennial average of diffuse PAR in China during 1981-2010 (mol m-2 d-1) |
Figure 5 Spatial distributions of perennial average of seasonal diffuse PAR in China during 1981-2010 (a, b, c and d represent spring, summer, autumn and winter; mol m-2 d-1) |
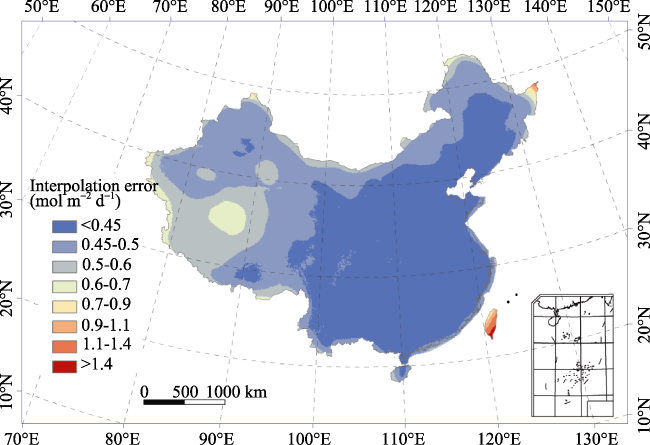
Figure 6 Spatial distribution of perennial average prediction standard errors of diffuse PAR in China during 1981-2010 (mol m-2 d-1) |
Figure 7 Anomalies of annual and seasonal average diffuse PAR averaged all over China from 1981 to 2010 (a denotes annual average diffuse PAR; b, c, d and e denote seasonal average diffuse PAR of spring, summer, autumn and winter respectively; mol m-2 d-1) |
Table 2 Linear regression coefficients of the anomalies of annual and seasonal average diffuse PAR from 1981 to 2010 |
| Annual | Spring | Summer | Autumn | Winter | |
|---|---|---|---|---|---|
| Slope | 0.003 | -0.001 | 0.009 | 0.008 | 0.002 |
| Intercept | 12.797 | 15.496 | 17.961 | 10.287 | 7.363 |
| R | 0.413* | 0.066 | 0.570* | 0.478* | 0.158 |
* Significant at α= 0.05 |
Figure 8 Spatial distribution of the variation rates of annual average diffuse PAR in China from 1981 to 2010(Blank areas denote that there are no statistically significant trends; % per year) |
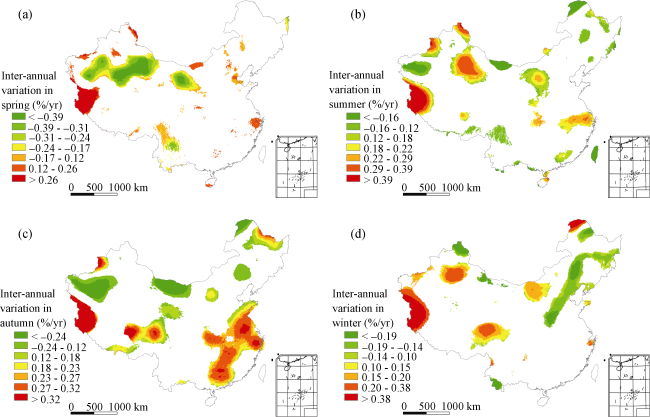
Figure 9 Spatial distribution of variation rates of seasonal average diffuse PAR in China from 1981 to 2010(Blank areas denote that there are no statistically significant trends; a, b, c and d denote spring, summer, autumn and winter; % per year) |
The authors have declared that no competing interests exist.
| 1 |
|
| 2 |
|
| 3 |
|
| 4 |
|
| 5 |
|
| 6 |
|
| 7 |
|
| 8 |
|
| 9 |
|
| 10 |
|
| 11 |
|
| 12 |
|
| 13 |
|
| 14 |
|
| 15 |
|
| 16 |
|
| 17 |
|
| 18 |
|
| 19 |
|
| 20 |
|
| 21 |
|
| 22 |
|
| 23 |
|
| 24 |
|
| 25 |
|
| 26 |
|
| 27 |
|
| 28 |
|
/
| 〈 |
|
〉 |