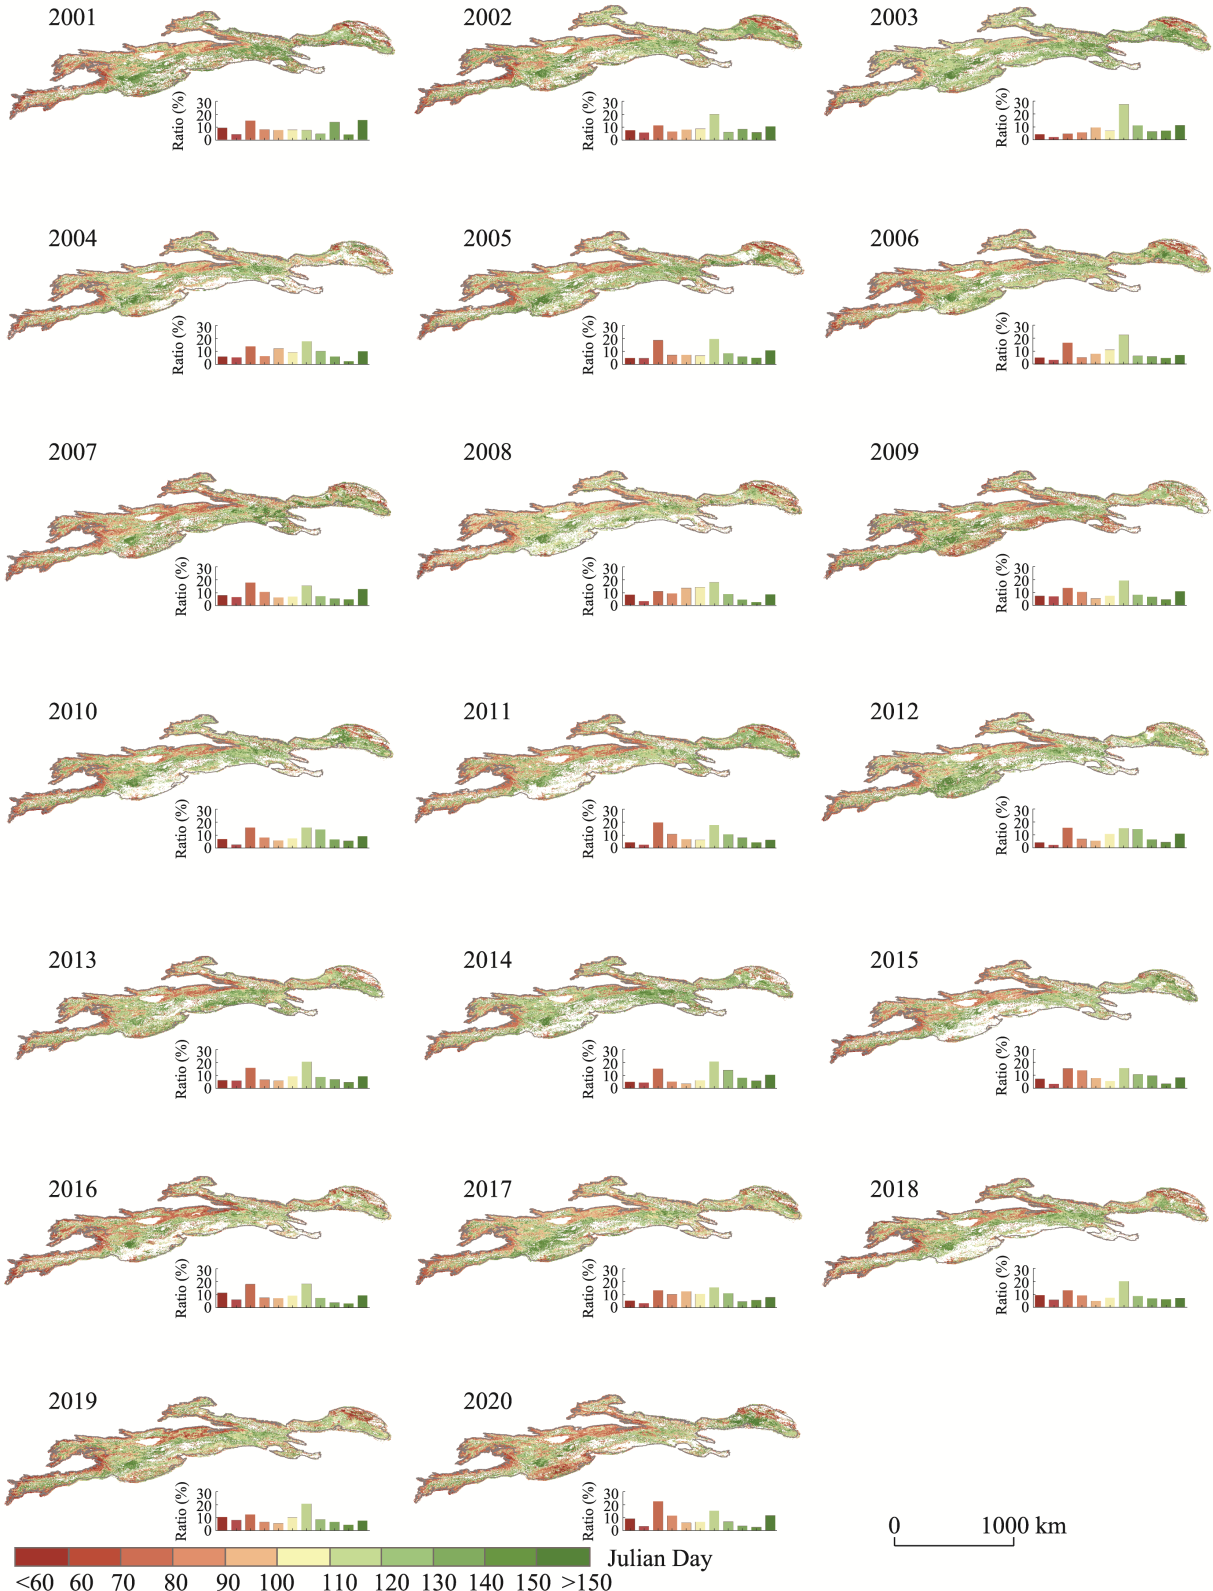
Figure 3 Spatial distributions of the vegetation green-up date in the Tianshan Mountains from 2001 to 2020 (The inset at the bottom left corner of each subfigure displays the frequency distributions of the corresponding green-up dates.)
Other figure/table from this article