×
模态框(Modal)标题
在这里添加一些文本
Close
Close
Submit
Cancel
Confirm
×
模态框(Modal)标题
×
Journal
Article
Figure
Search
EN
中文
Home
About Journal
About Journal
Indexed in
Awards
Editorial Board
Guide for Authors
Browse
Current Issue
Online First
Archive
Highlights
Topic
Archive by Subject
Most Viewed
Most Download
Most Cited
E-mail Alert
RSS
Subscribe
Advertisement
Contact us
EN
中文
Figure/Table detail
Characteristics of the iron mineralogy of farmland and red soils in eastern Guangdong and their pedogenetic implications
CHEN Zixuan, TANG Jinmeng, LIU Xin, LU Bin, YANG Junhuai, WANG Shuyuan, XIA Dunsheng
Journal of Geographical Sciences
, 2025, 35(
9
): 2015-2036. DOI:
10.1007/s11442-025-2401-9
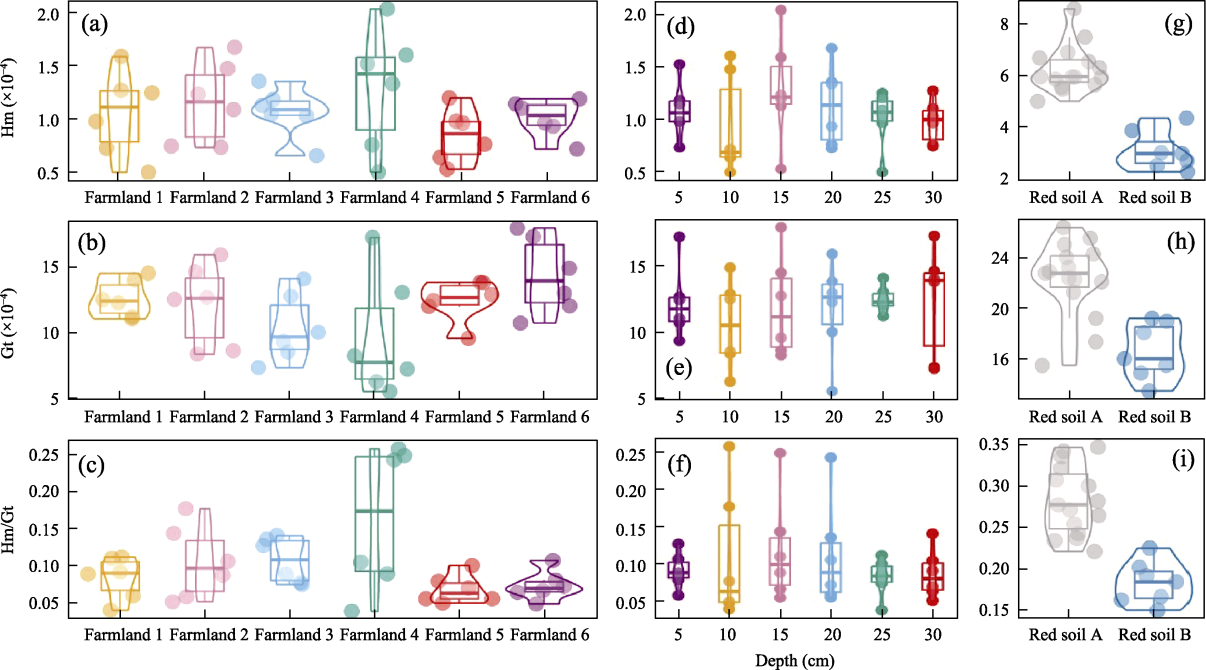
Figure 6
Violin boxplots (a, b, c) and box plots (d, e, f) based on depth of Hm, Gt, and Hm/Gt in various farmland; and violin boxplots of Hm, Gt, and Hm/Gt in red soils (g, h, i)
Other figure/table from this article
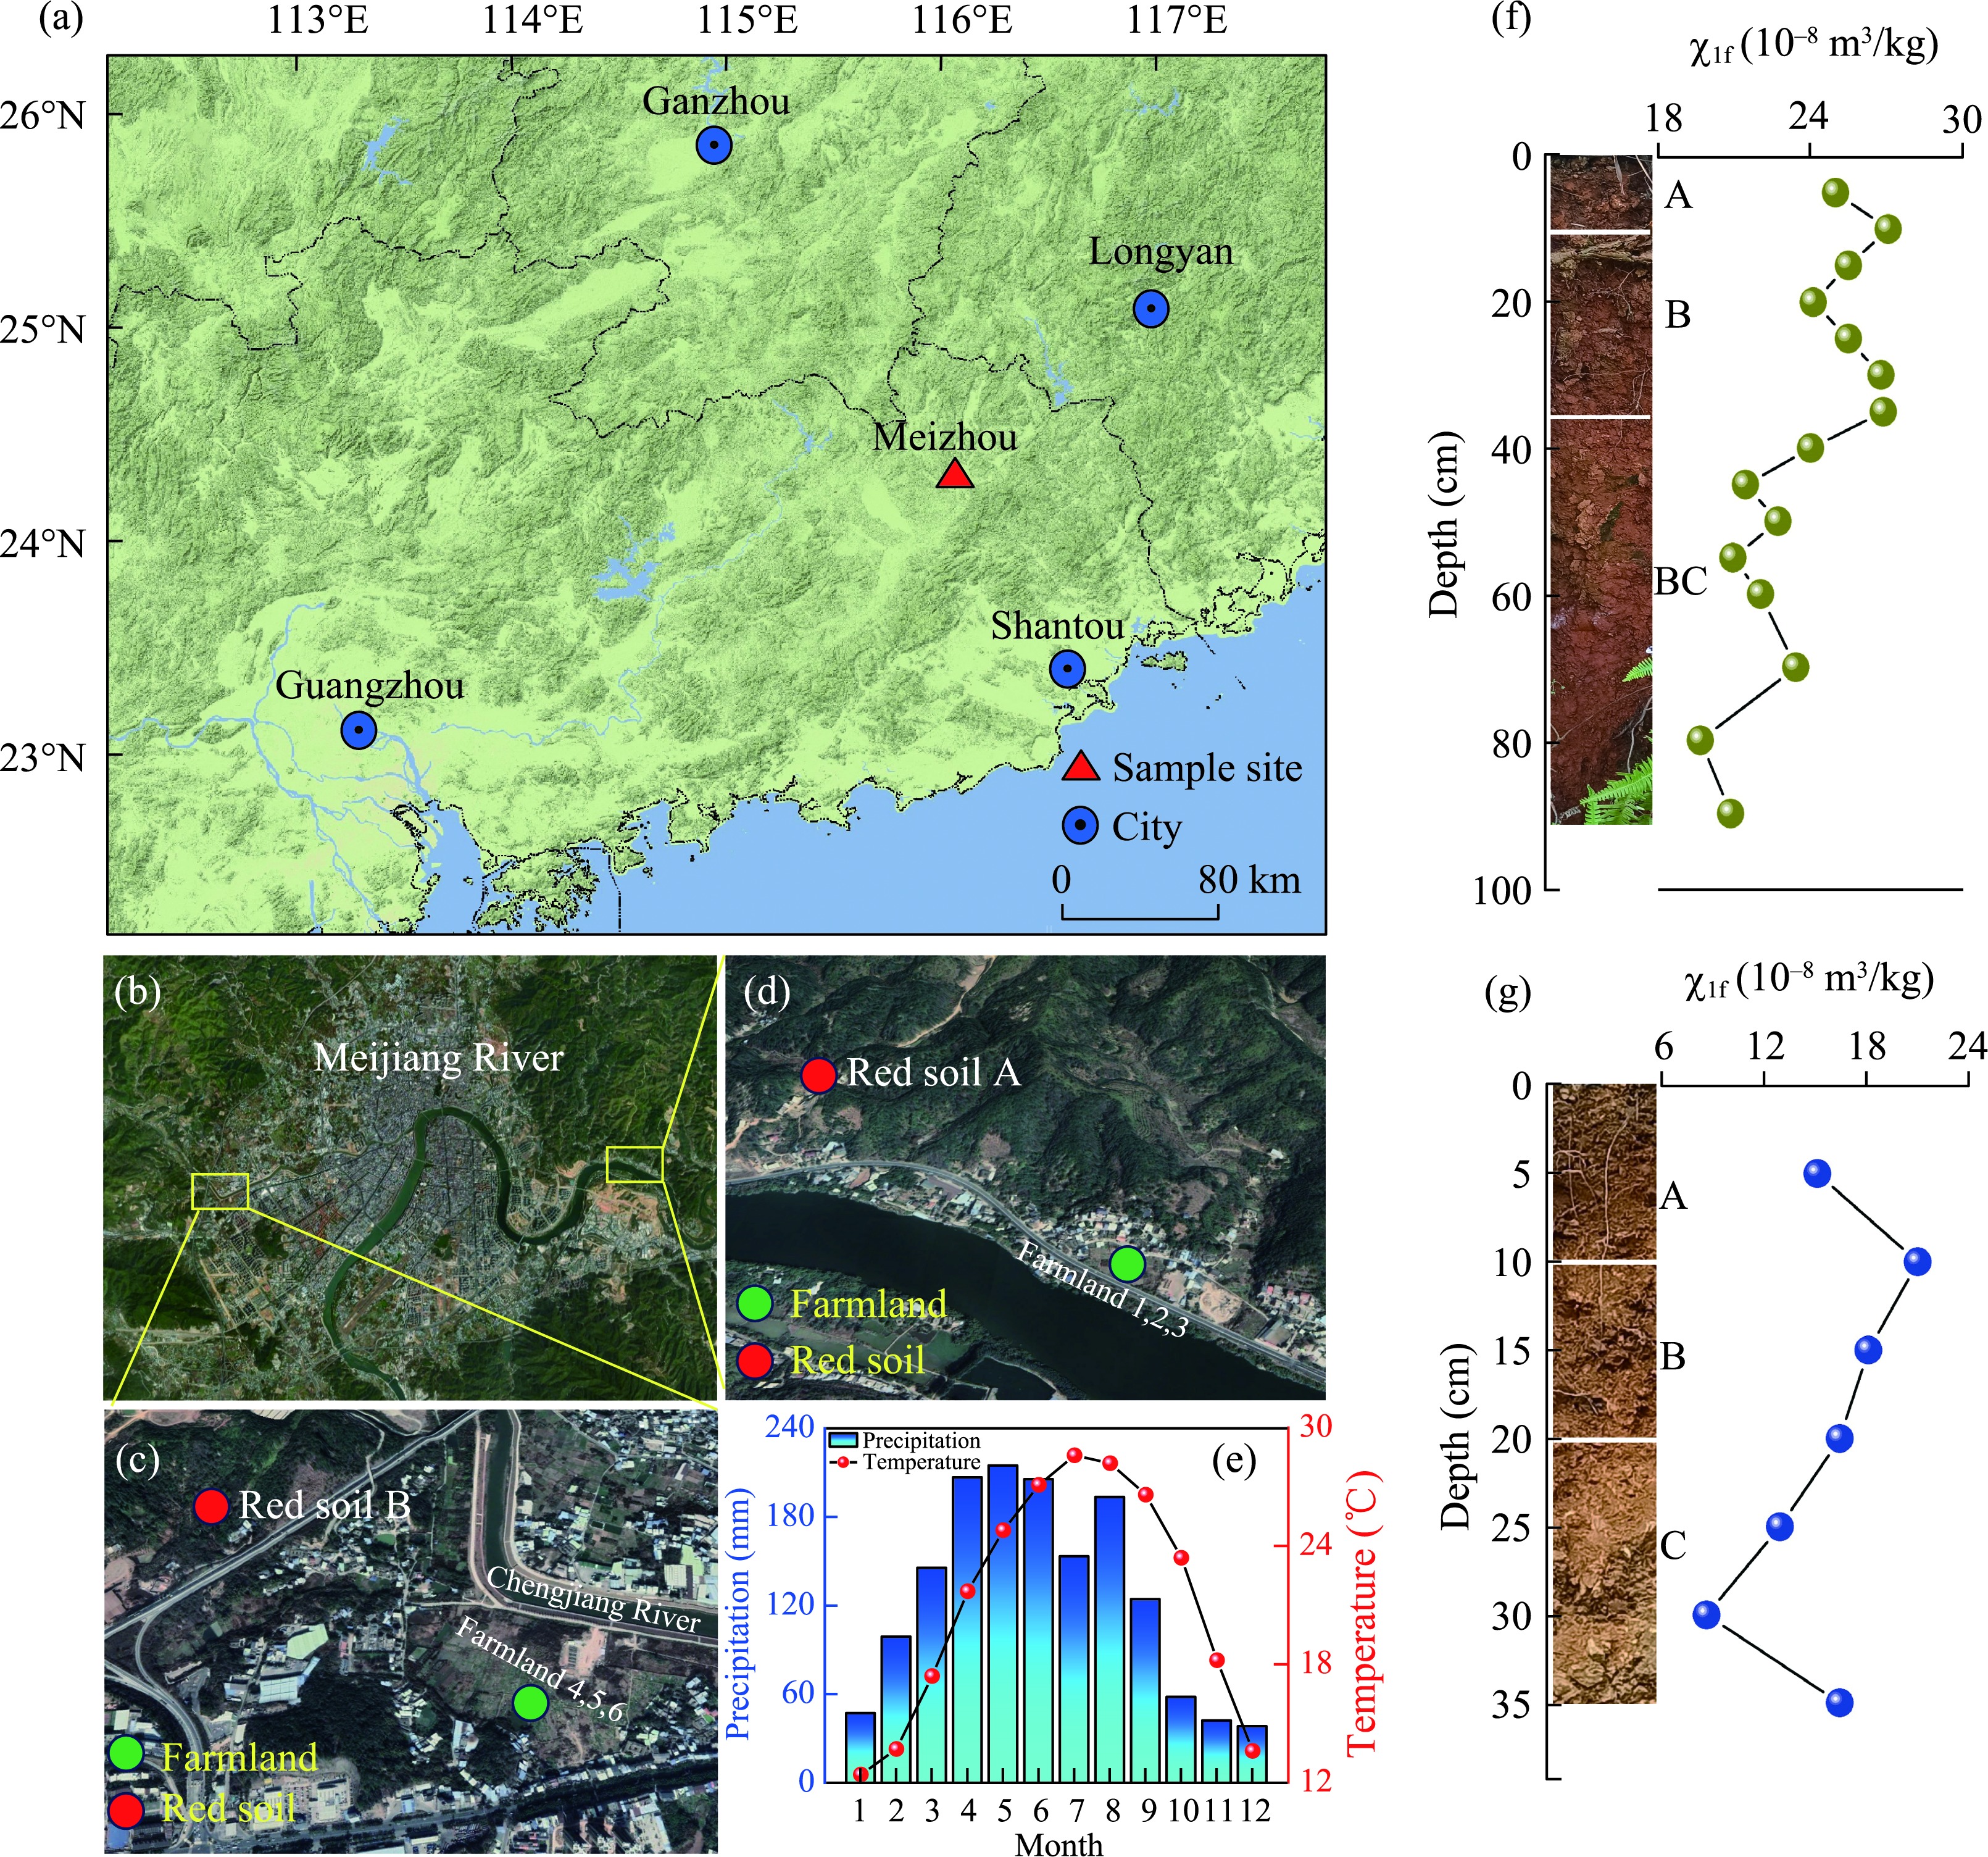
Figure 1
Study area (a), image of the area (b), sampling location (c, d), meteorological information (e), stratigraphy and magnetic susceptibility of red soil A (f), stratigraphy and magnetic susceptibility of red soil B (g) of Meizhou city
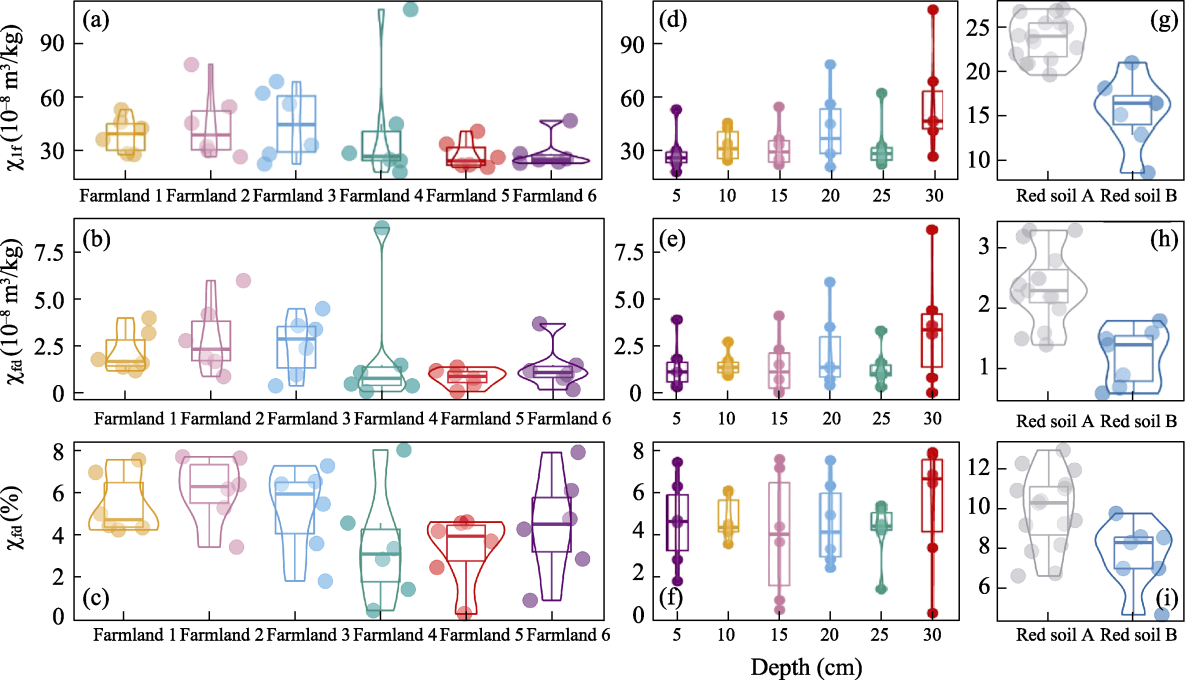
Figure 2
Violin box plots (a, b, c) and box plots based on depths (d, e, f) of χ
lf
, χ
fd
and χ
fd
% in various farmland; and violin box plots of χ
lf
, χ
fd
and χ
fd
% in the red soils (g, h, i)
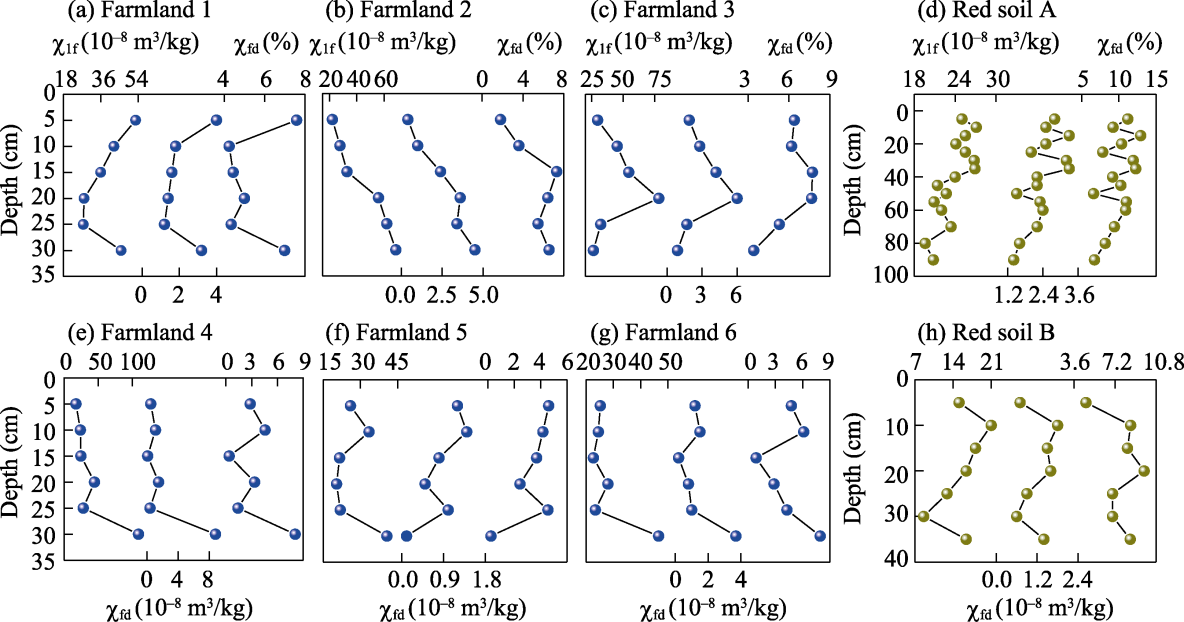
Figure 3
Changes in χ
lf
, χ
fd
and χ
fd
% based on the depth in farmland and red soils
Figure 4
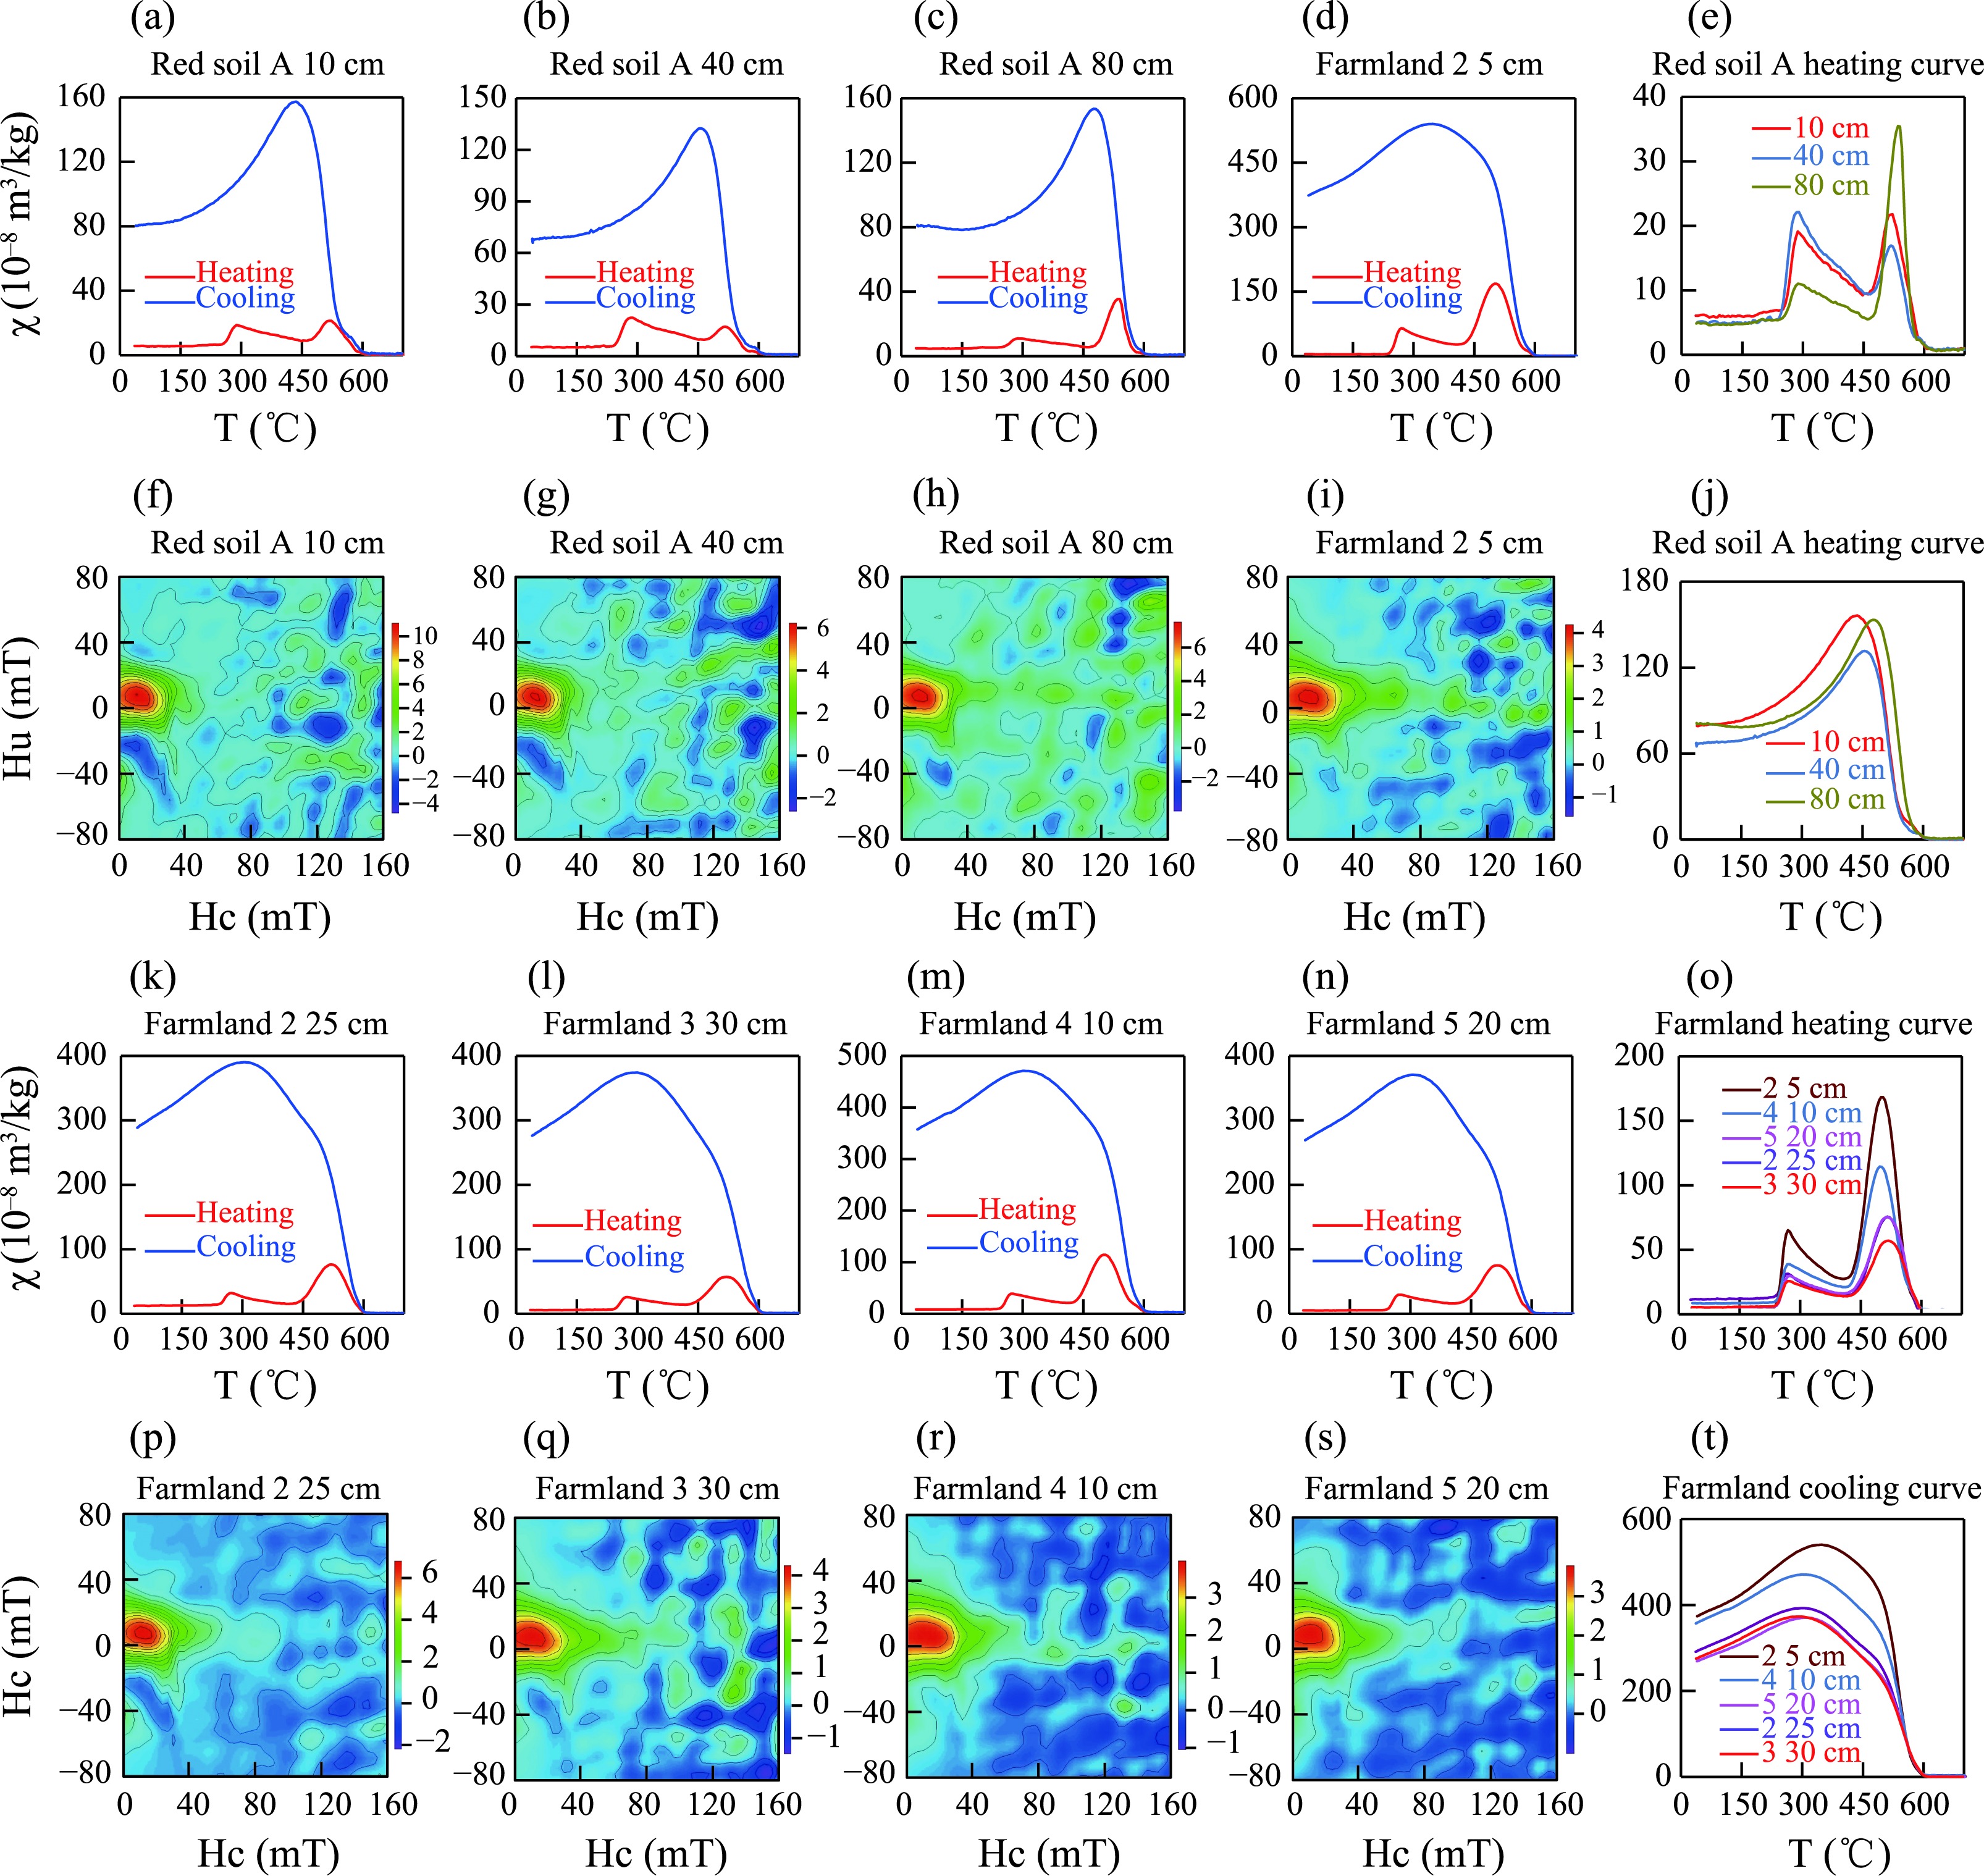
χ-T curves and FORC diagrams of typical samples from red and farmland soils
Figure 5
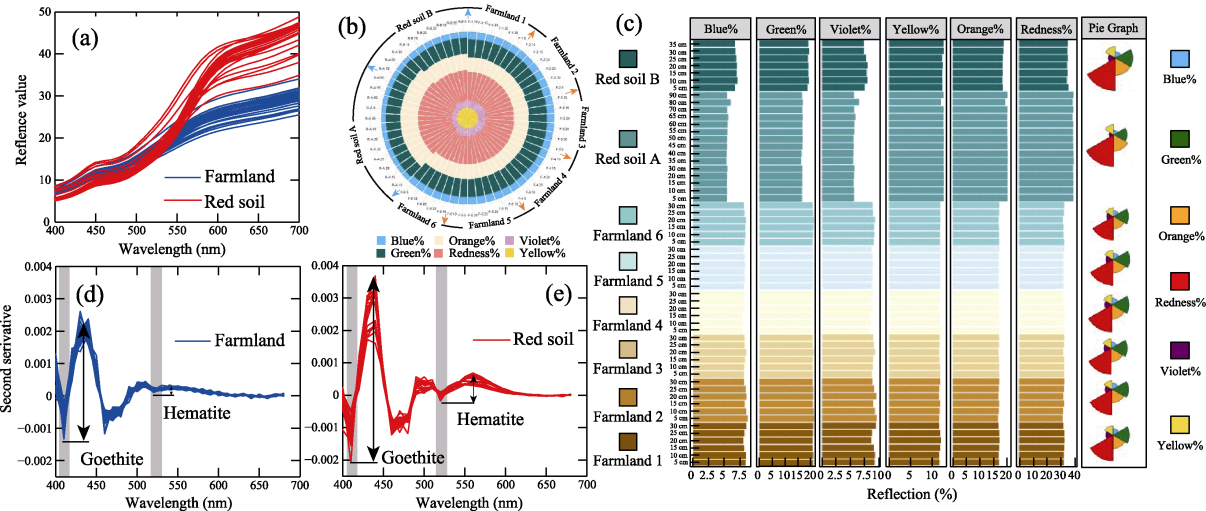
Diffuse reflectance spectroscopy (DRS) curves (a), stacked pie chart (b) of reflectivity for each color band, and bar chart of reflectivity for each color band with a pie chart of average values for each section (c), second-order derivative curve of DRS (d, e) of farmland and red soils
Figure 7
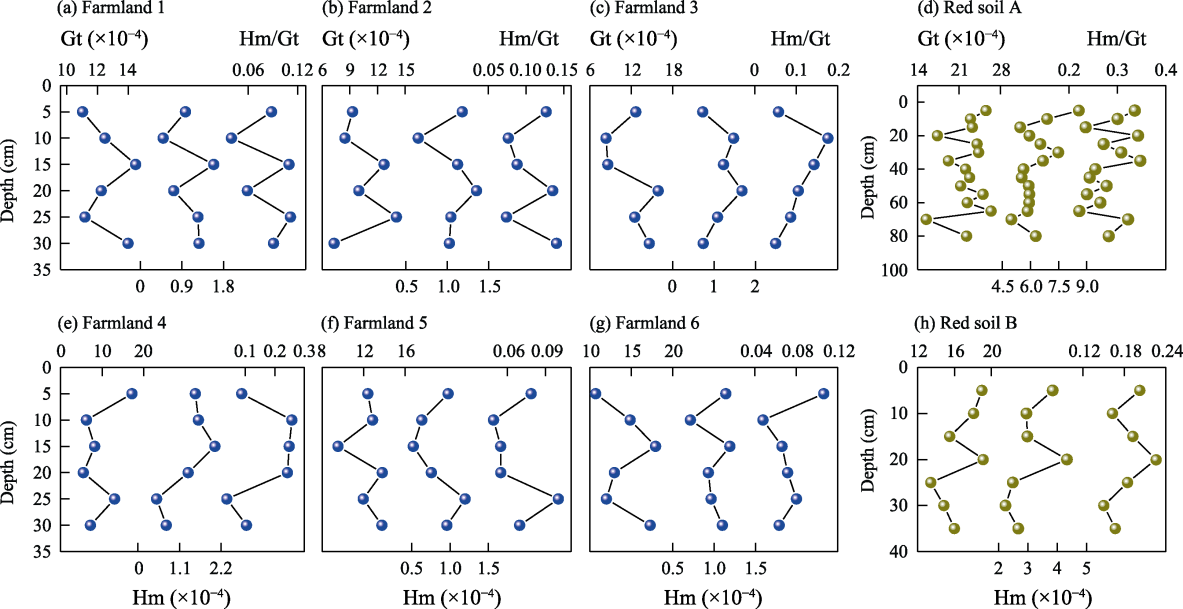
Changes in Hm, Gt and Hm/Gt based on depth in farmland and red soils
Figure 8
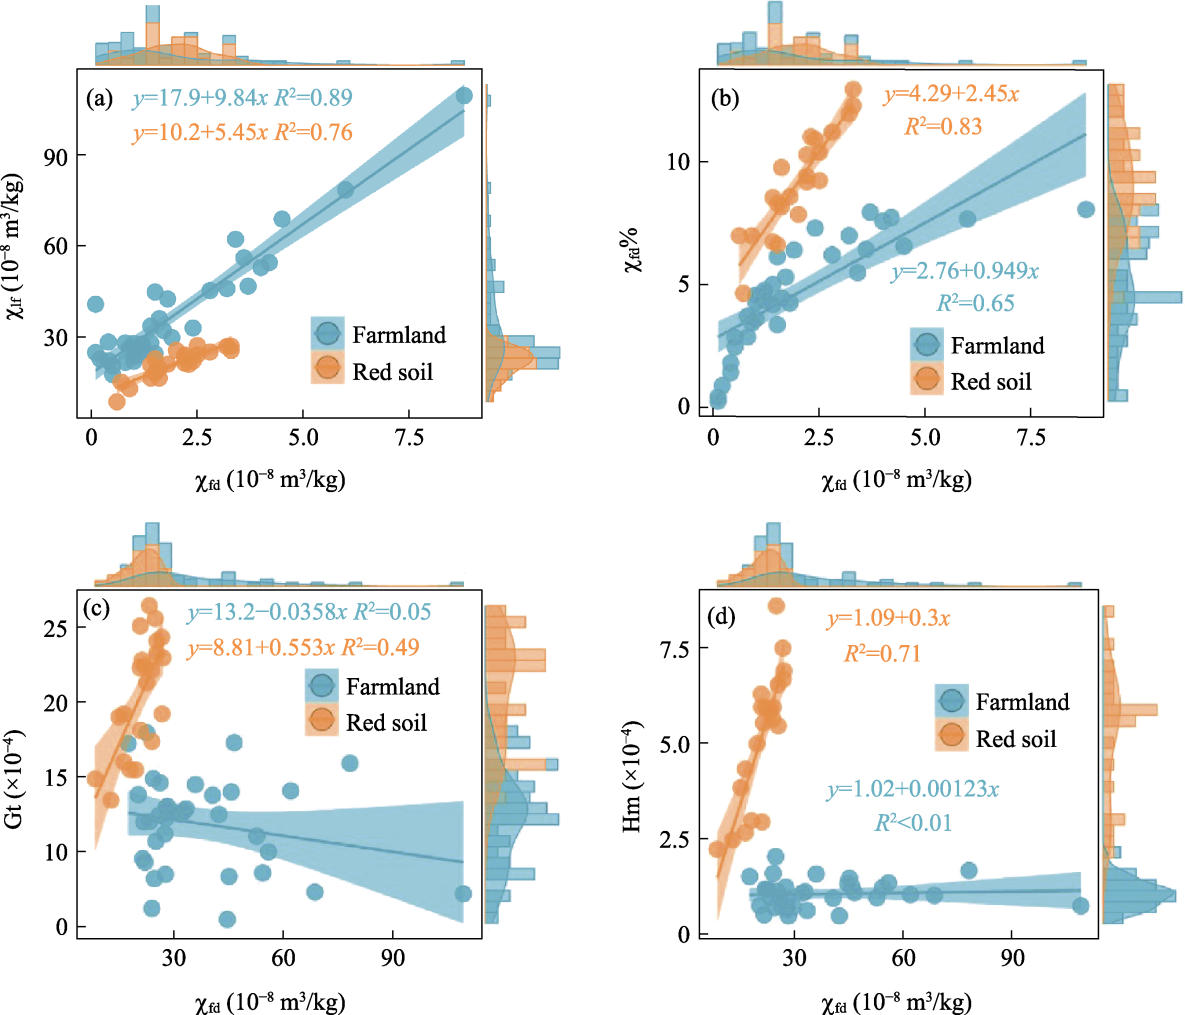
Scatter plot analysis of magnetic parameters (a. χ
fd
vs. χ
lf
; b. χ
fd
vs. χ
fd
%; c. χ
lf
vs. Gt; d. χ
lf
vs. Hm)
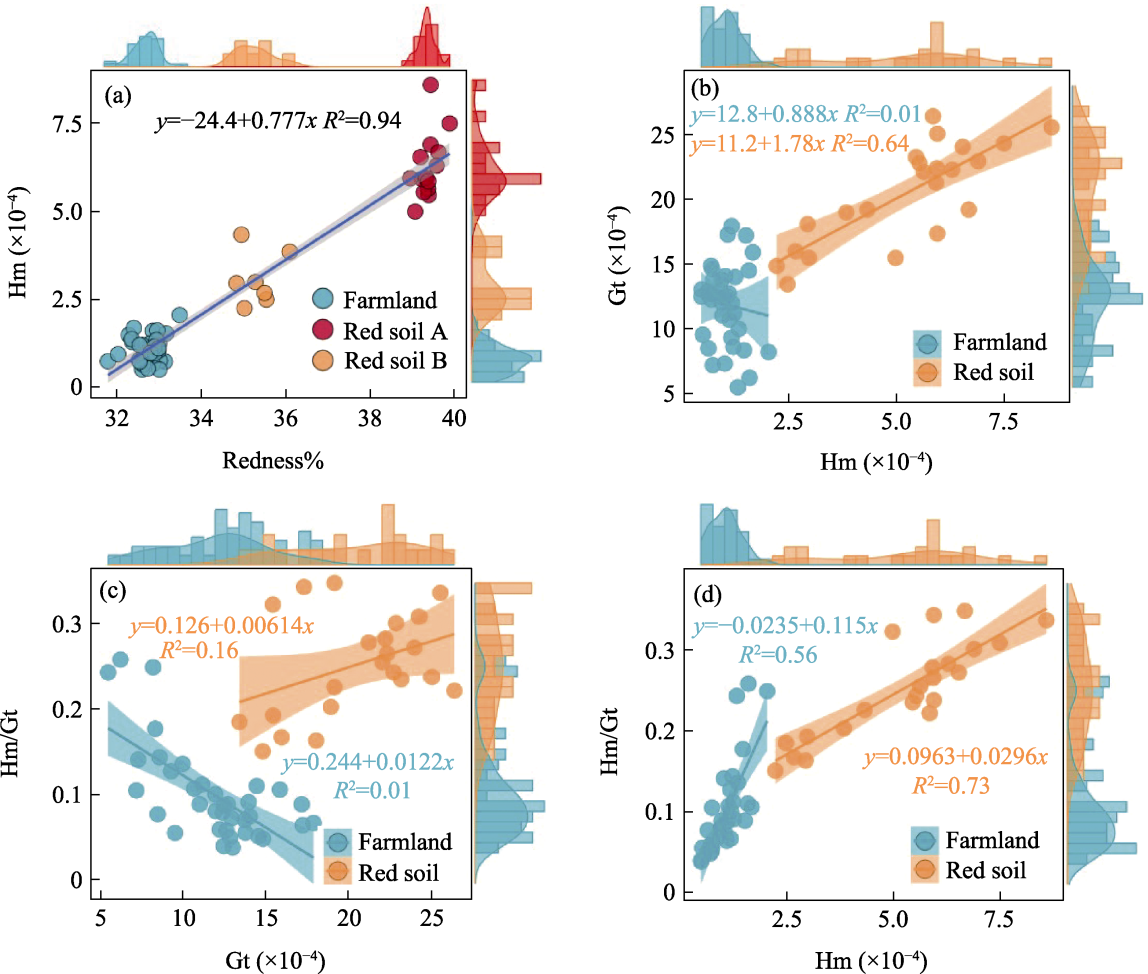
Figure 9
Scatter plot analysis of DRS parameters (a. Redness% vs. Hm; b. Hm vs. Gt; c. Gt vs. Hm/Gt; d. Hm vs. Hm/Gt)
Figure 10
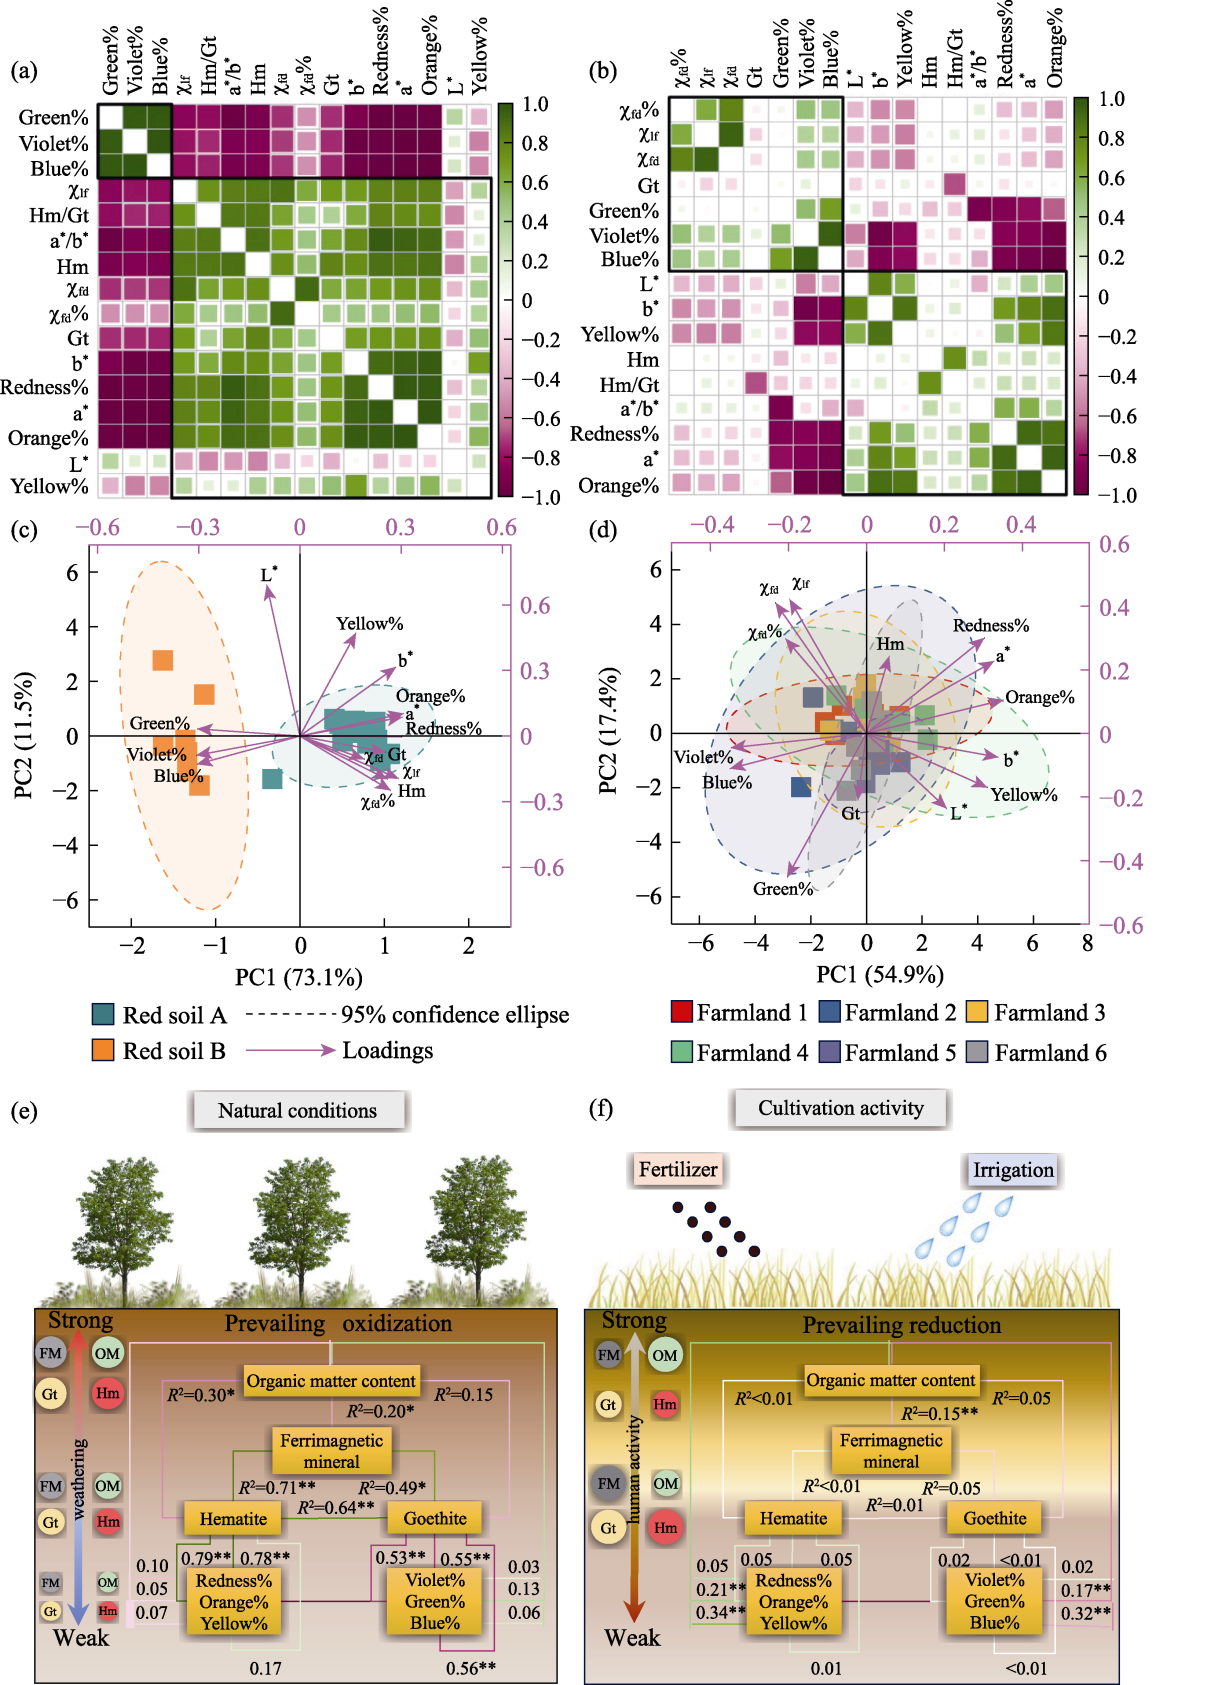
Correlation heatmap analysis (a, b) and principal component analysis (c, d) of various indicators within red and farmland soils; correlation between ferromagnetic mineral (FM), hematite (Hm), goethite (Gt), organic matter (OM), and soil color; and stratigraphic changes in magnetic minerals (e, f). The size of the circle corresponds to the average content within the layers, while the background color indicates the stratigraphic variations. Asterisks mark their significance: **, <0.01; or *, <0.05.