×
模态框(Modal)标题
在这里添加一些文本
Close
Close
Submit
Cancel
Confirm
×
模态框(Modal)标题
×
Journal
Article
Figure
Search
EN
中文
Home
About Journal
About Journal
Indexed in
Awards
Editorial Board
Guide for Authors
Browse
Current Issue
Online First
Archive
Highlights
Topic
Archive by Subject
Most Viewed
Most Download
Most Cited
E-mail Alert
RSS
Subscribe
Advertisement
Contact us
EN
中文
Figure/Table detail
Investigating nonlinear factors influencing multi-scale urban land surface temperature using machine learning models
SHI Yue, FAN Qiang, SUN Shuang, SONG Xiaonan, ZHANG Bing
Journal of Geographical Sciences
, 2025, 35(
9
): 1998-2014. DOI:
10.1007/s11442-025-2400-x
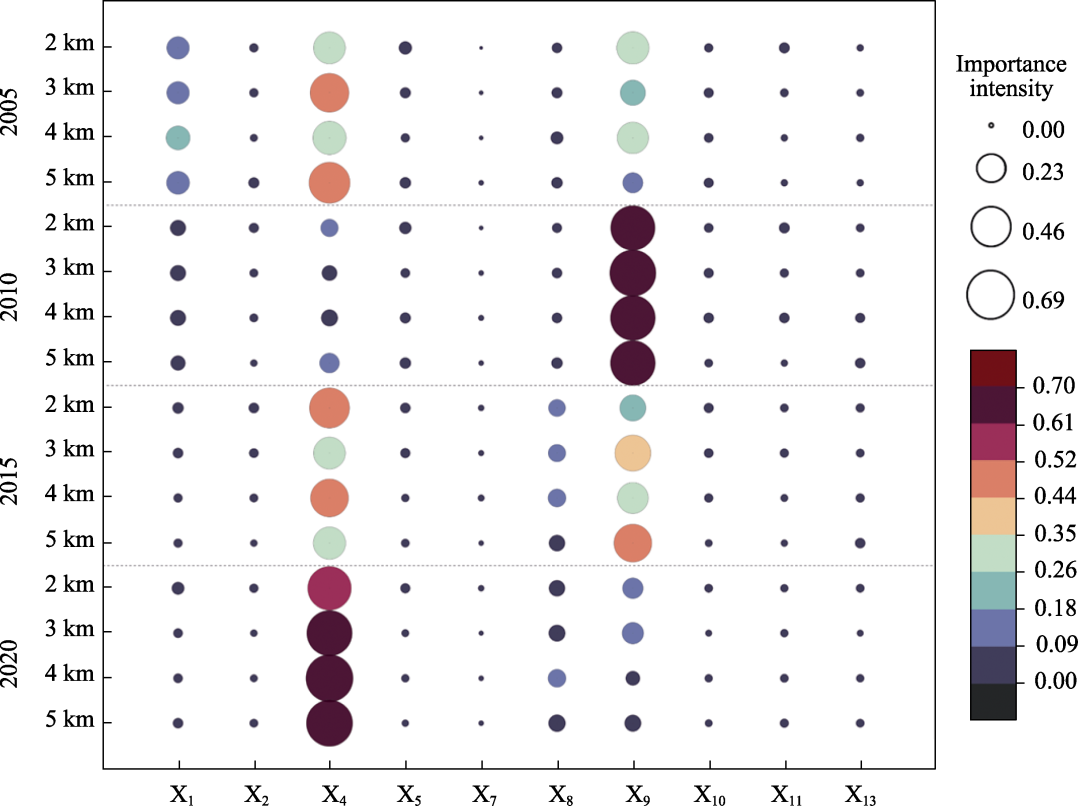
Figure 6
Significance ranking of factors (The size of the symbols represents the strength of the influence, while the colour gradient visually illustrates the impact of each factor on LST.)
Other figure/table from this article
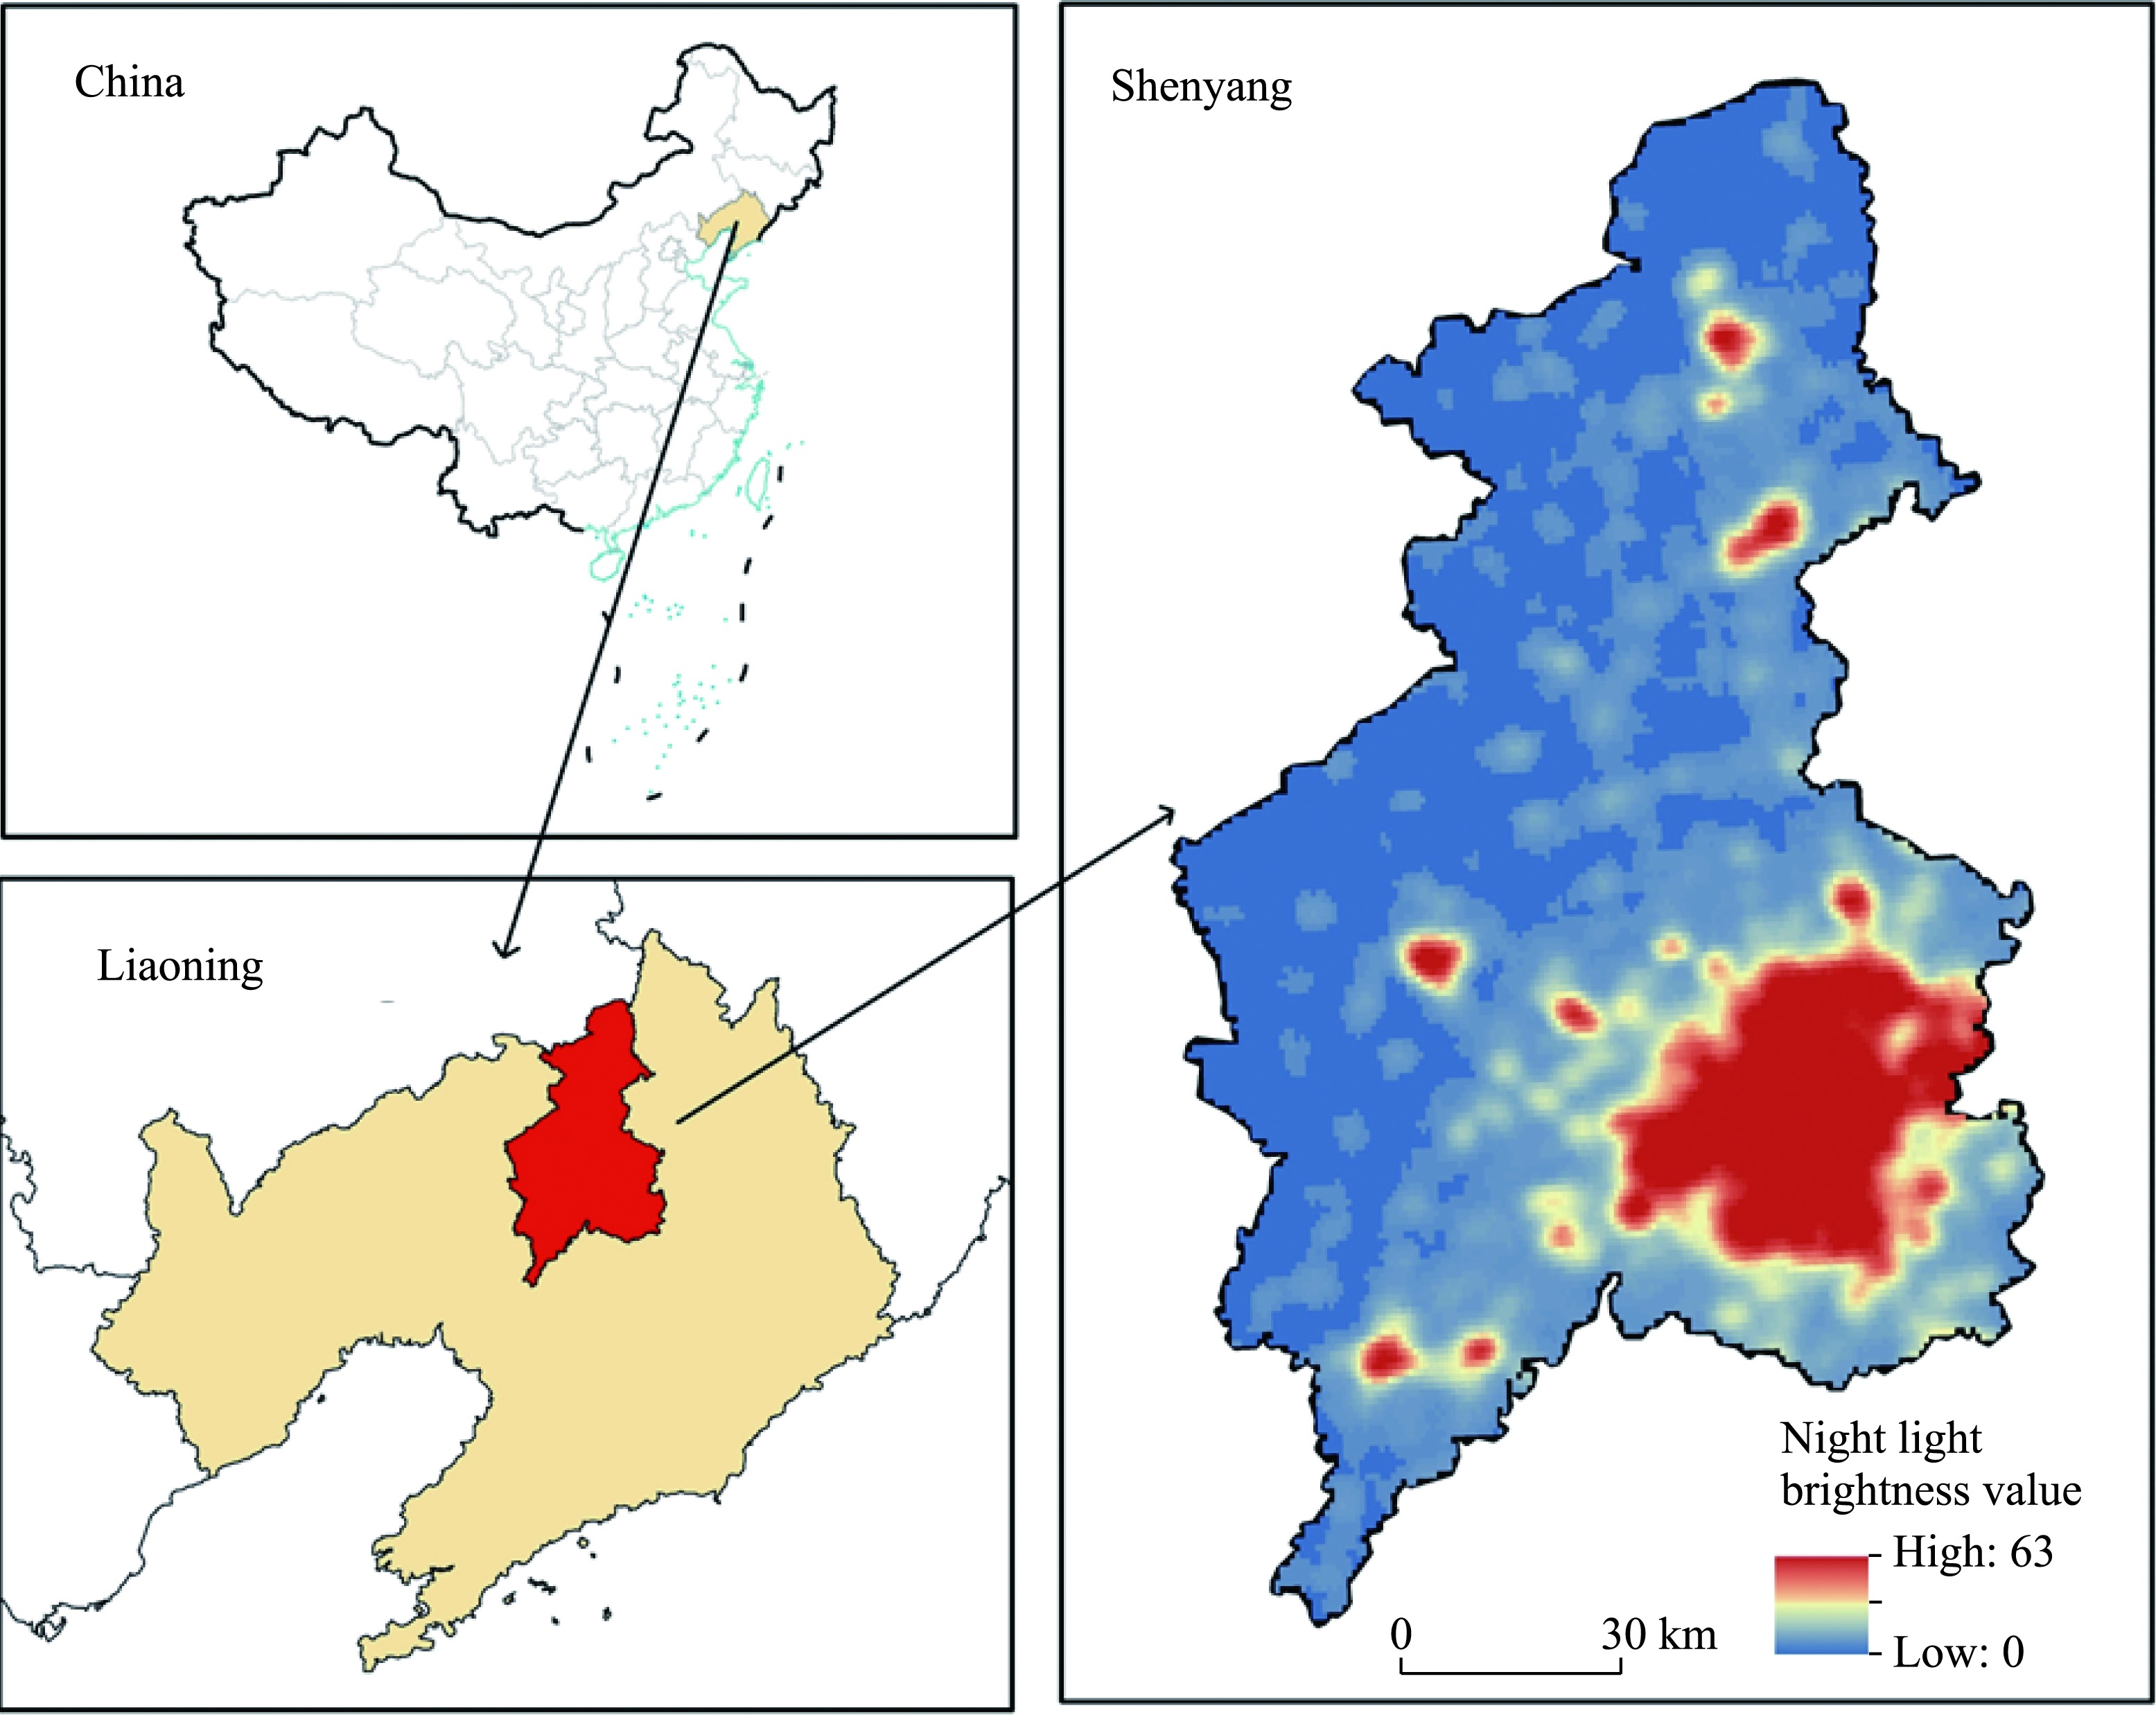
Figure 1
Location of Shenyang city, Liaoning province, Northeast China (Note: With the map approval number GS(2024)0650, the base map remains unmodified.)
Table 1
Classification rules for different temperature zones
Table 2
Landscape index and its significance
Table 3
Factors influencing LST
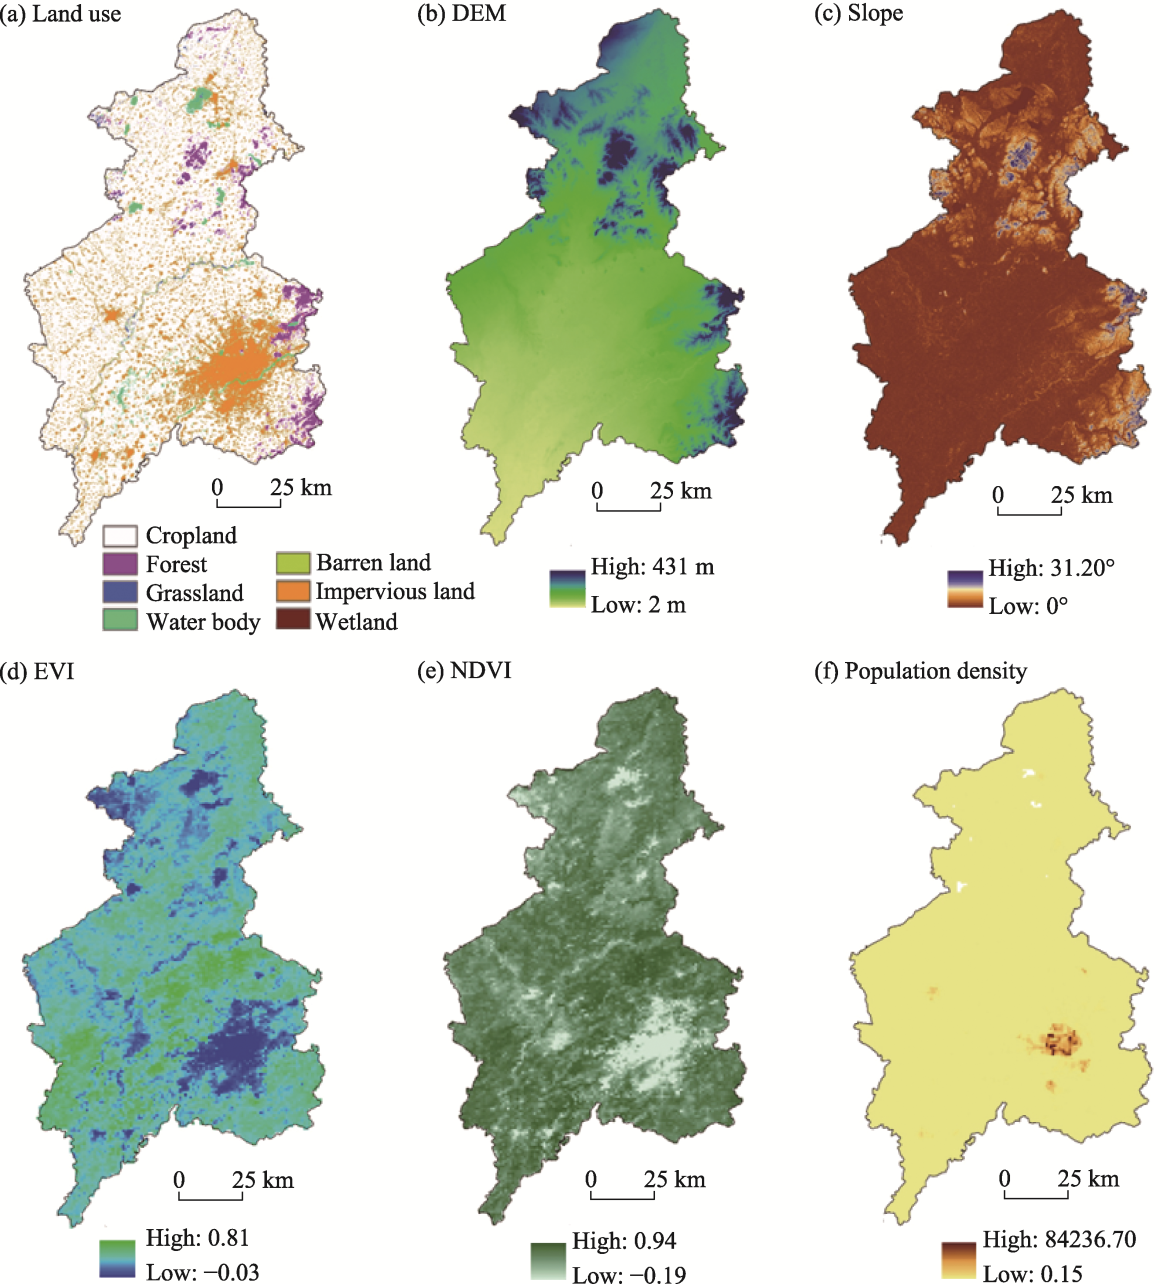
Figure 2
Spatial variation map of influencing factors in Shenyang for 2020 (Note: Owing to space limitations, only the spatial distribution of the influencing factors for 2020 is shown.)
Figure 3
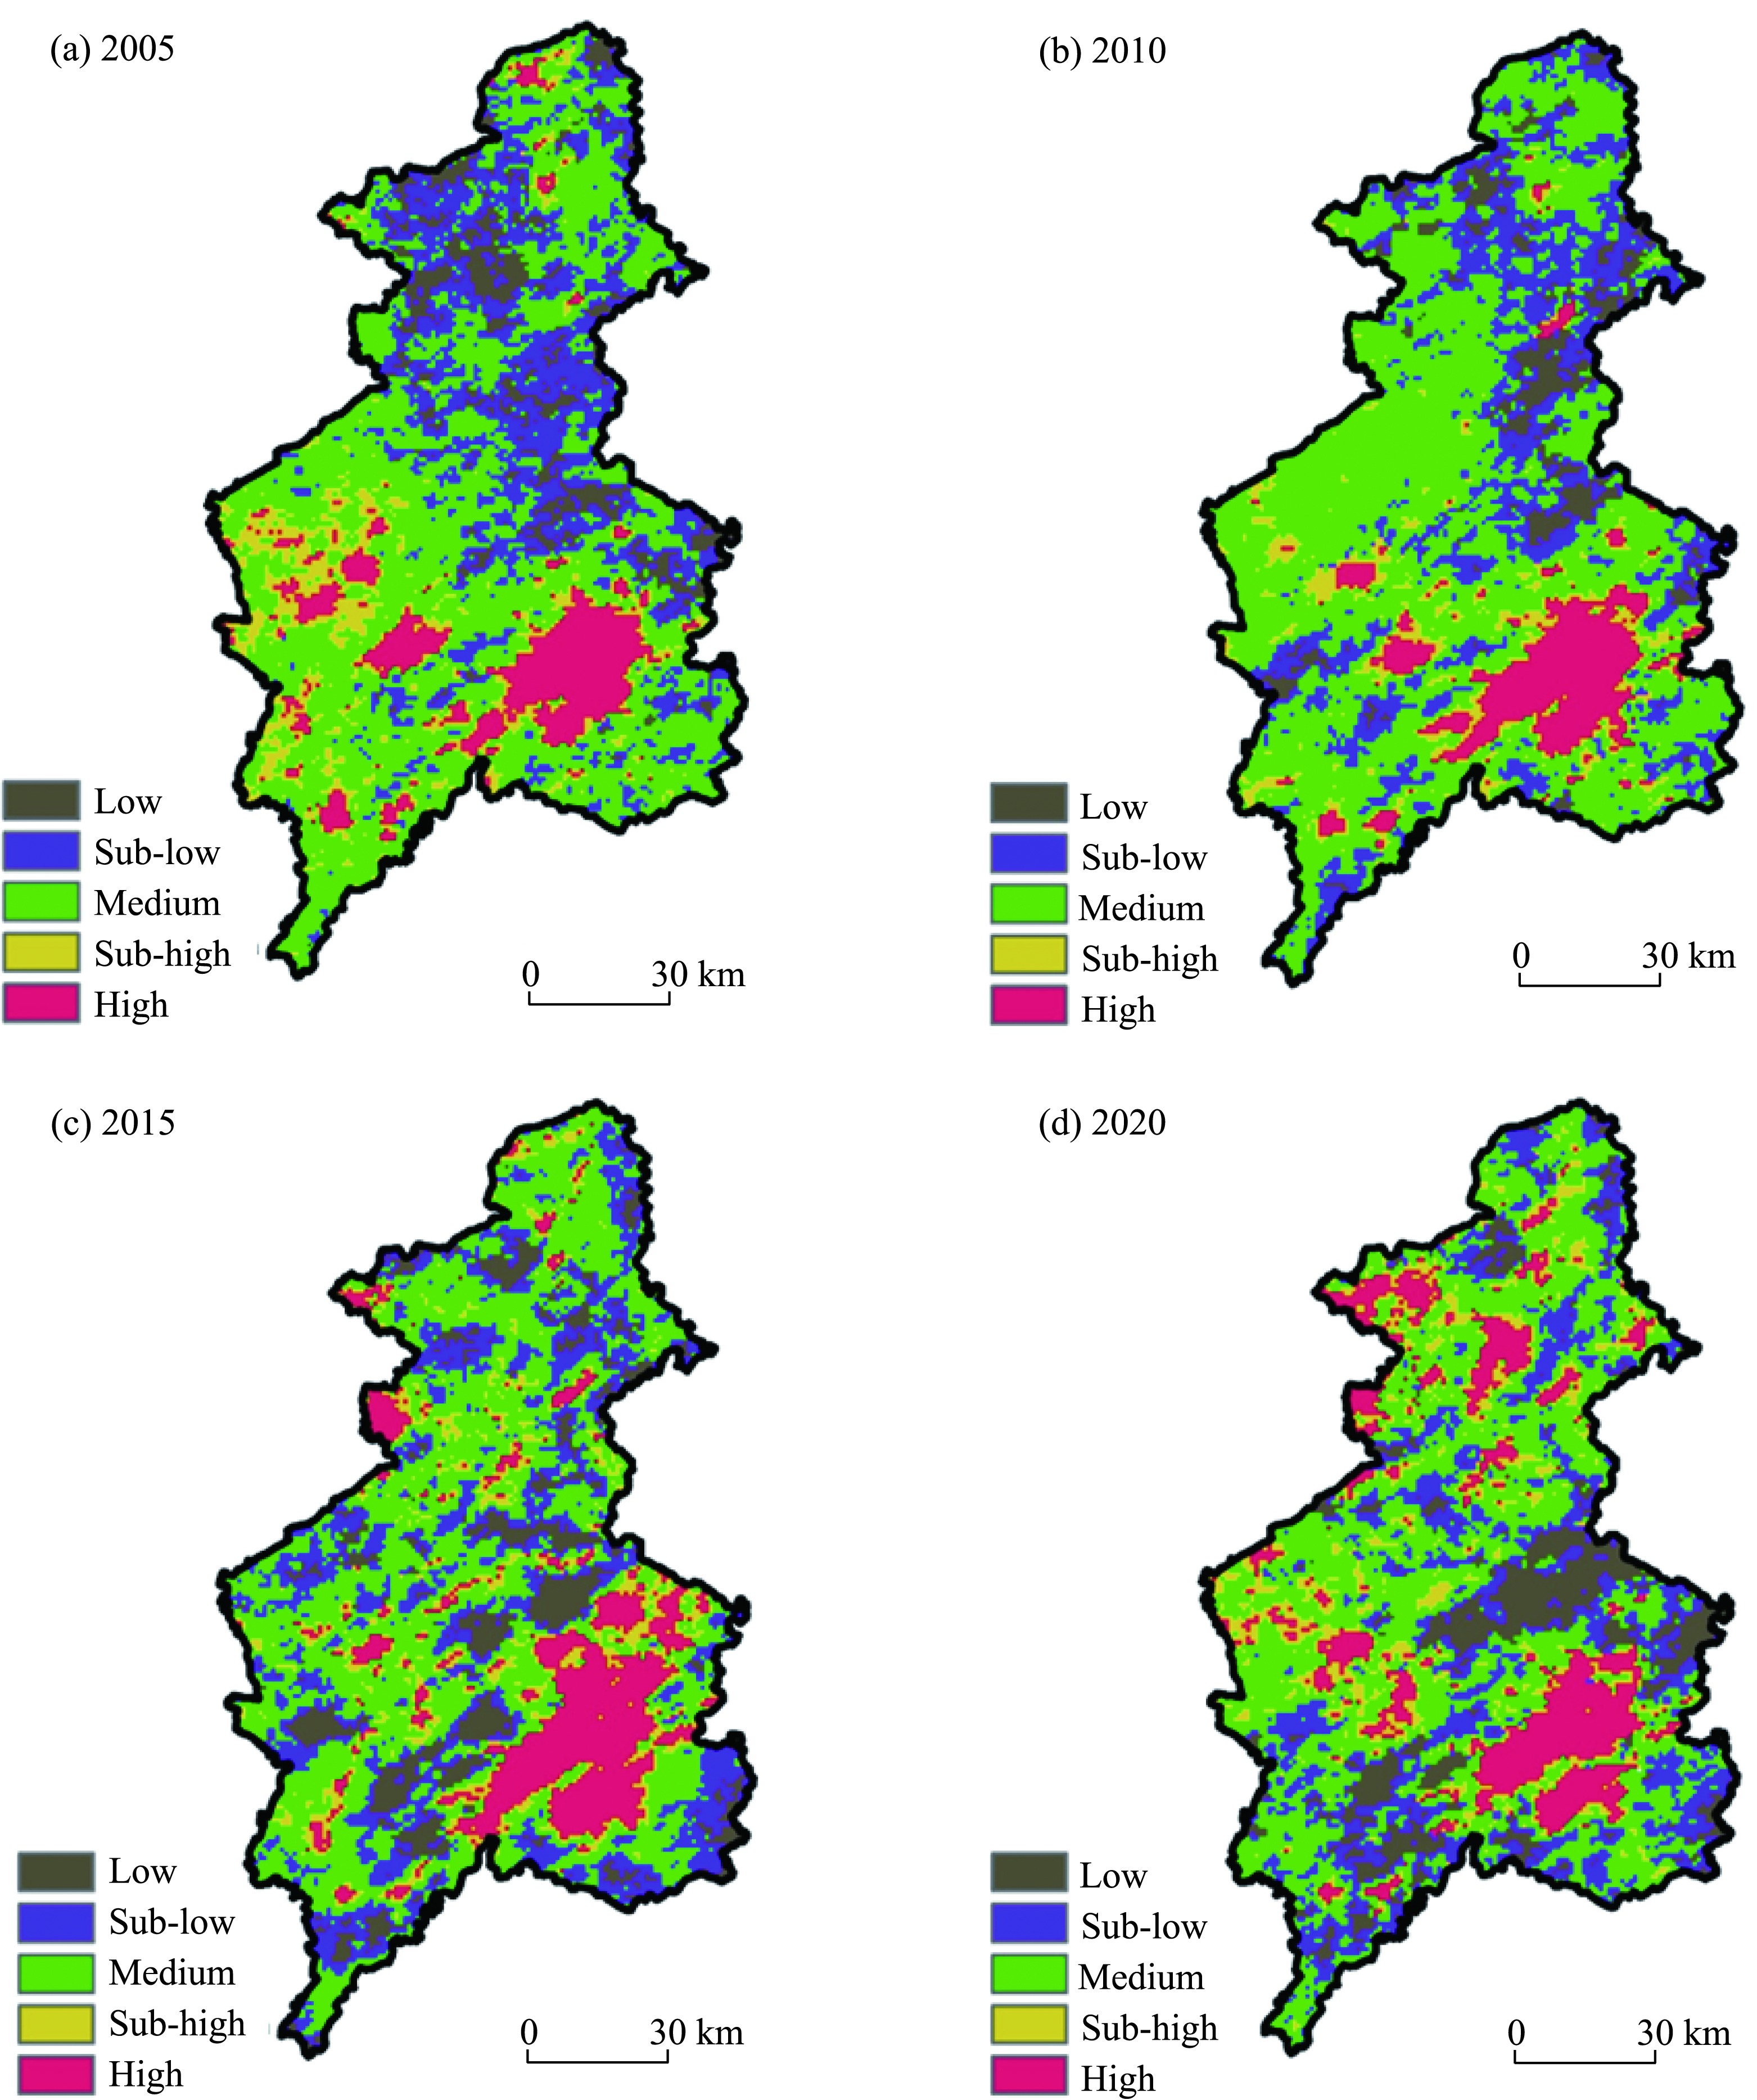
Mean standard deviation classification map of LST in Shenyang for 2005, 2010, 2015 and 2020
Table 4
Area and proportion of temperature classifications
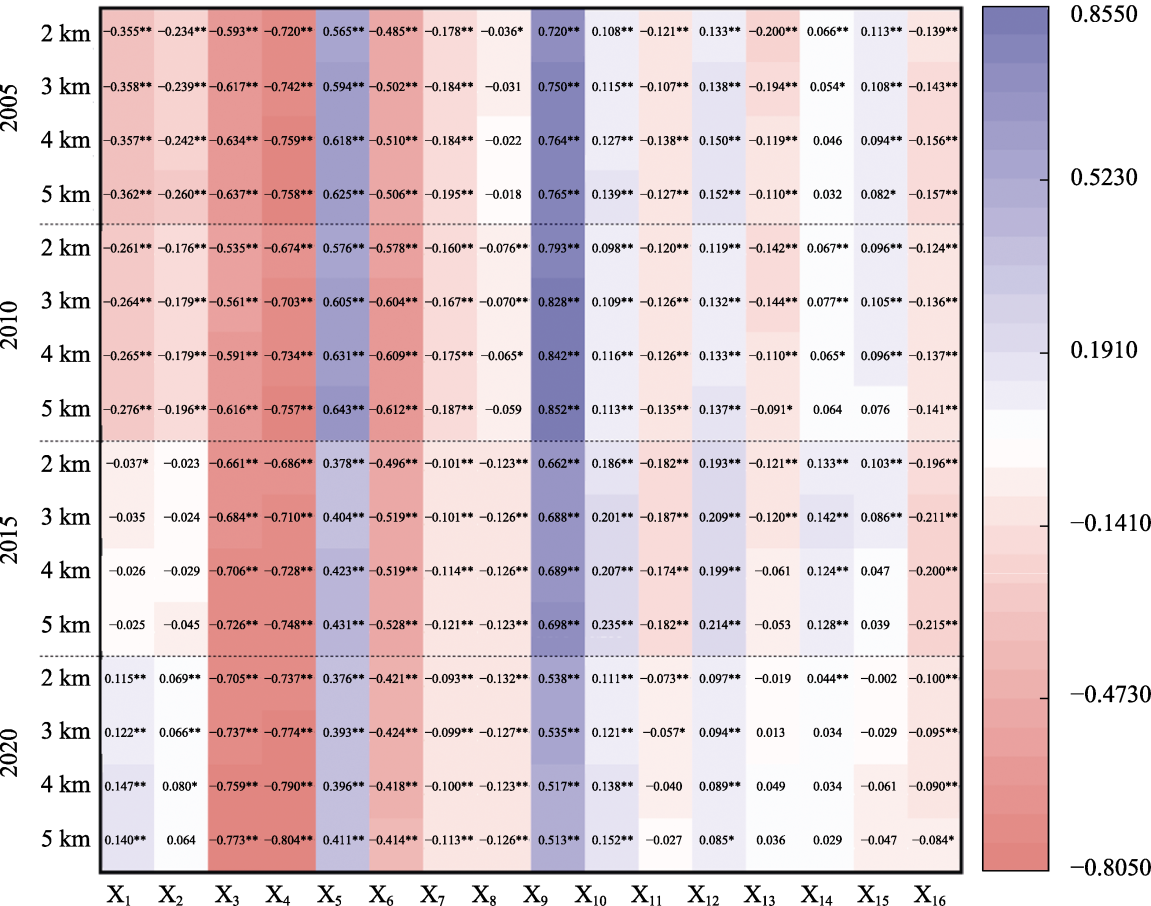
Figure 4
Pearson’s analysis results at different scales for 2005, 2010, 2015 and 2020 (*p < 0.05, ** p < 0.01)
Figure 5
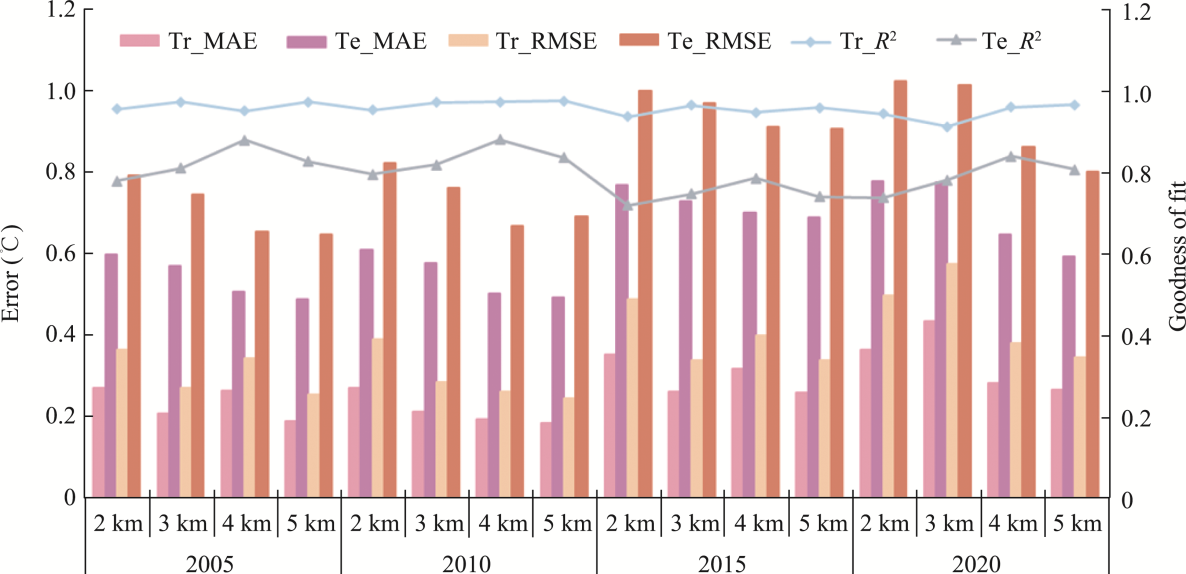
Training and test set results