| 2005 | 2010 | 2015 | 2020 | |||||
|---|---|---|---|---|---|---|---|---|
| Area (km2) | Proportion (%) | Area (km2) | Proportion (%) | Area (km2) | Proportion (%) | Area (km2) | Proportion (%) | |
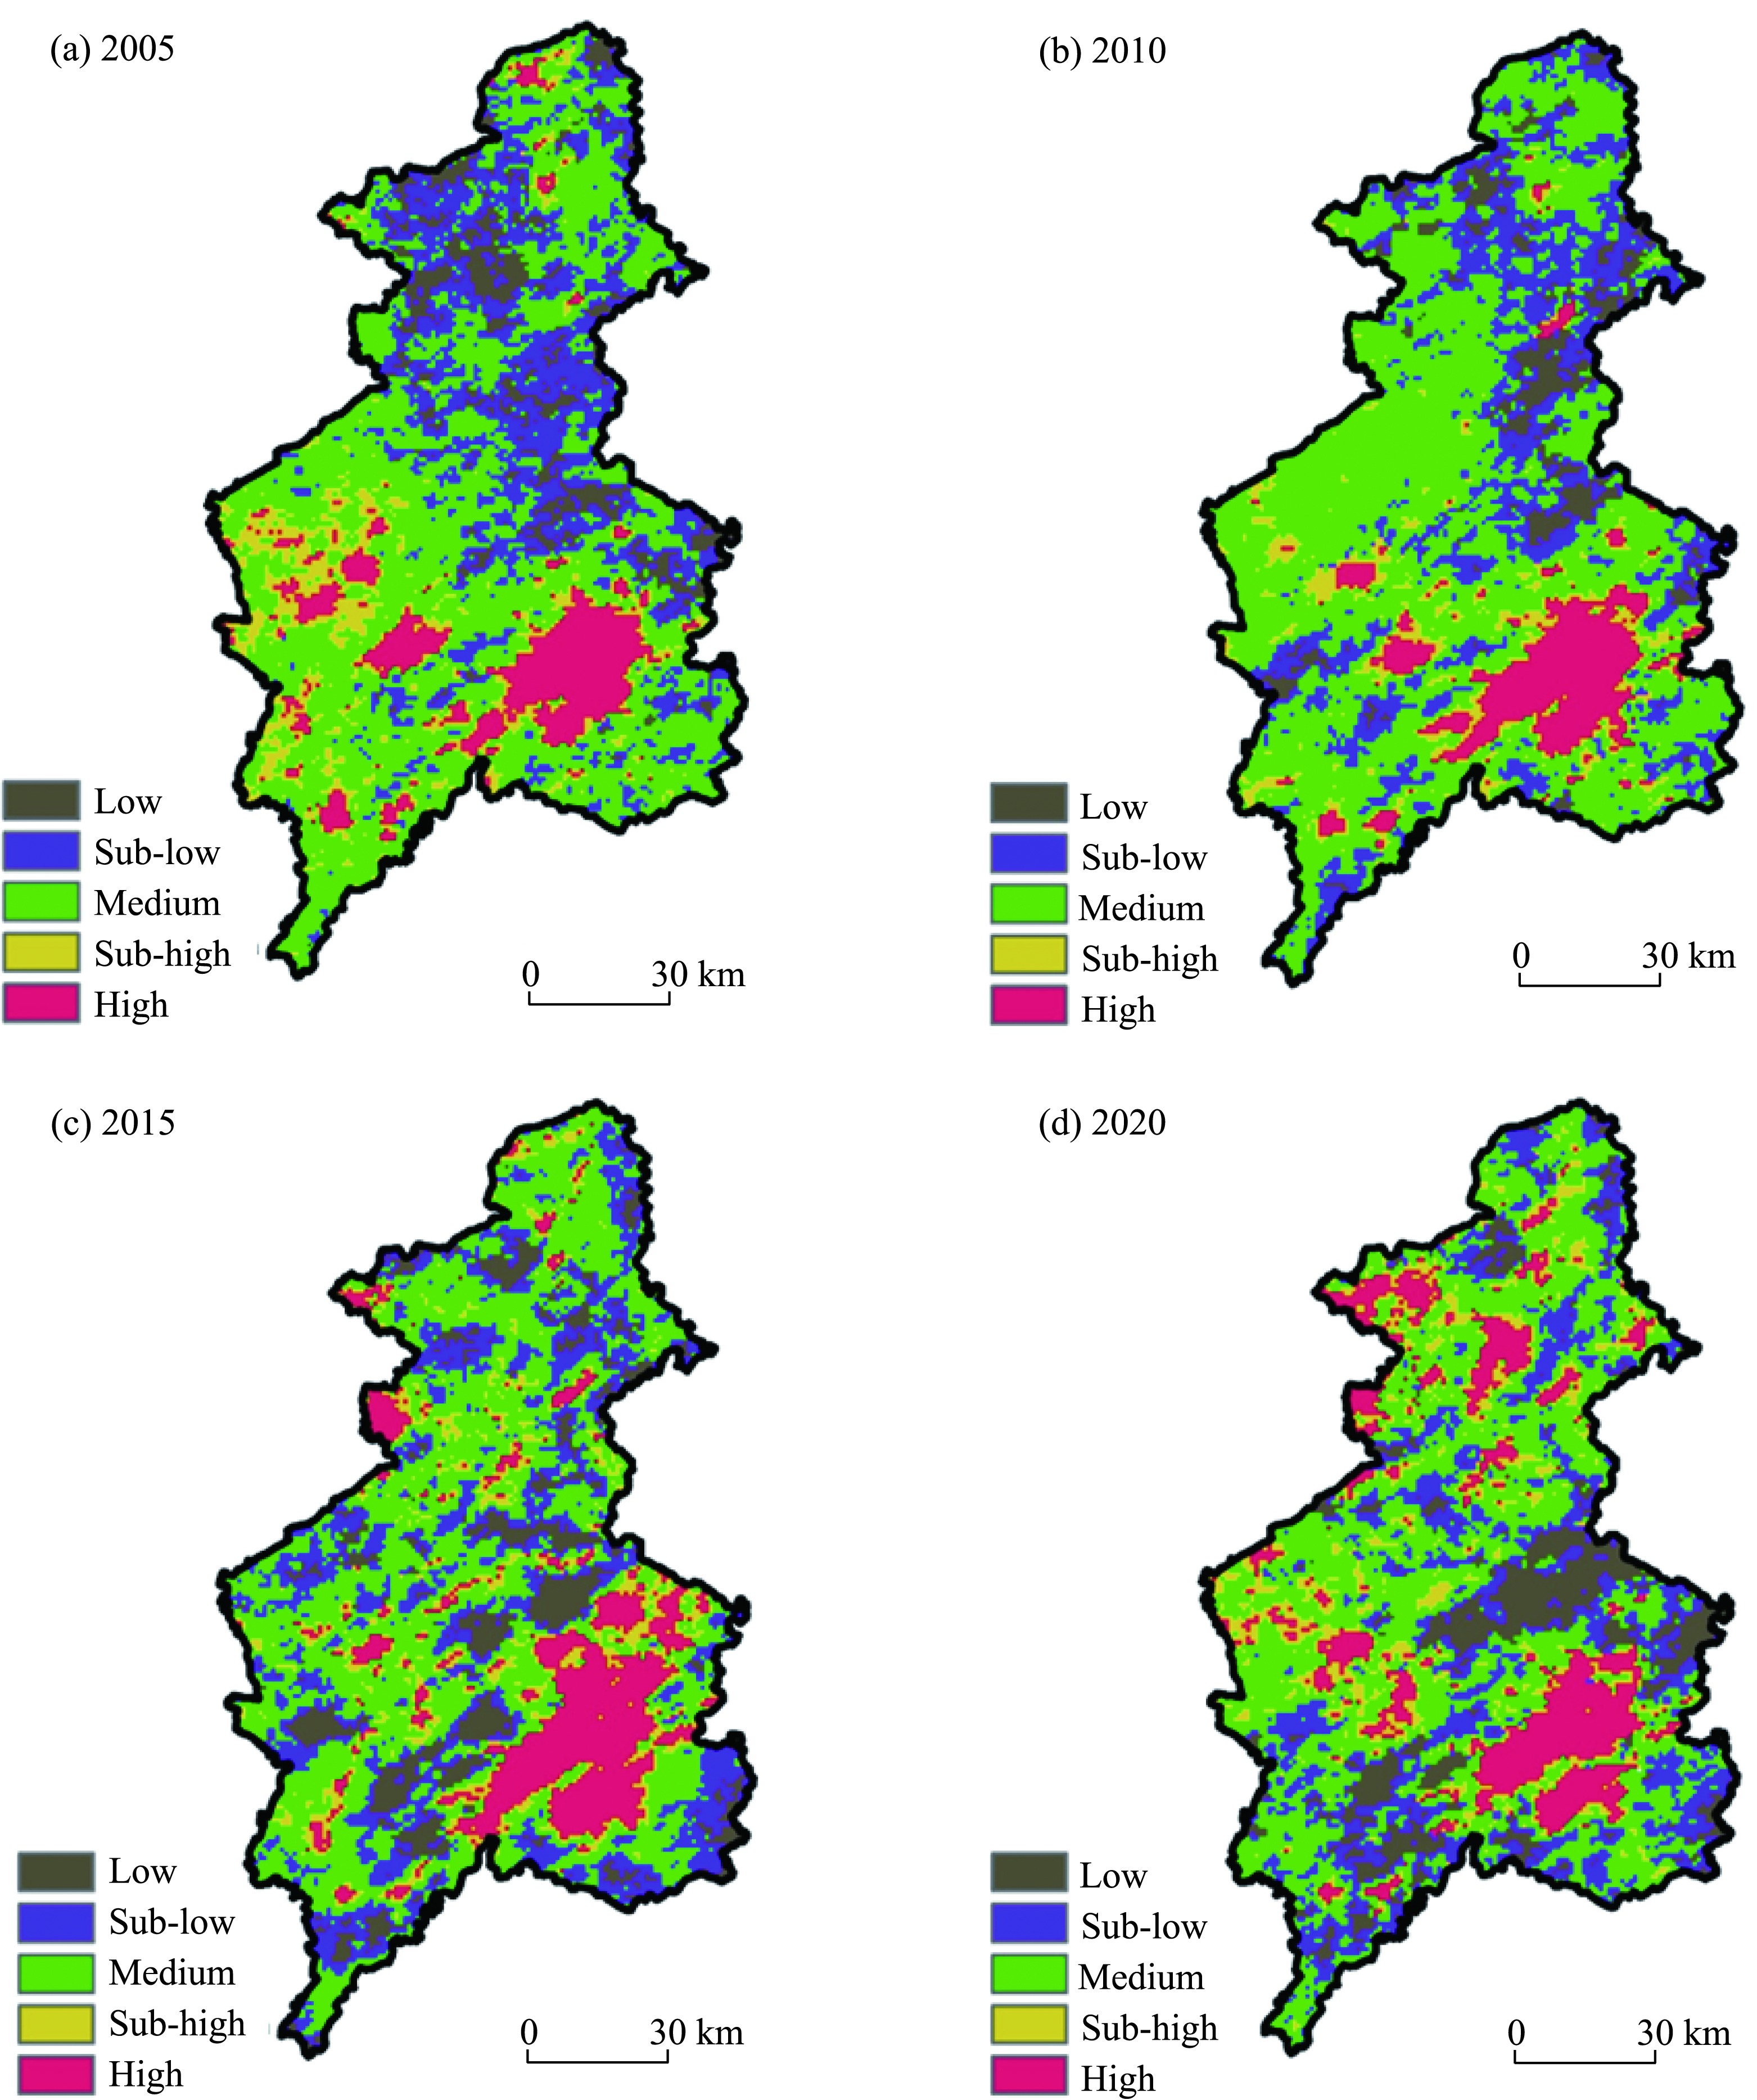
| Low | 1147.99 | 8.91 | 905.86 | 7.03 | 1480.29 | 11.49 | 1638.47 | 12.71 |
| Sub-low | 2668.64 | 20.71 | 2601.66 | 20.19 | 2725.31 | 21.15 | 2513.42 | 19.51 |
| Medium | 6468.10 | 50.20 | 7297.55 | 56.64 | 5715.93 | 44.37 | 5530.67 | 42.92 |
| Sub-high | 1348.92 | 10.47 | 922.17 | 7.16 | 1224.41 | 9.50 | 1455.59 | 11.30 |
| High | 1251.03 | 9.71 | 1157.44 | 8.98 | 1738.74 | 13.49 | 1746.53 | 13.56 |