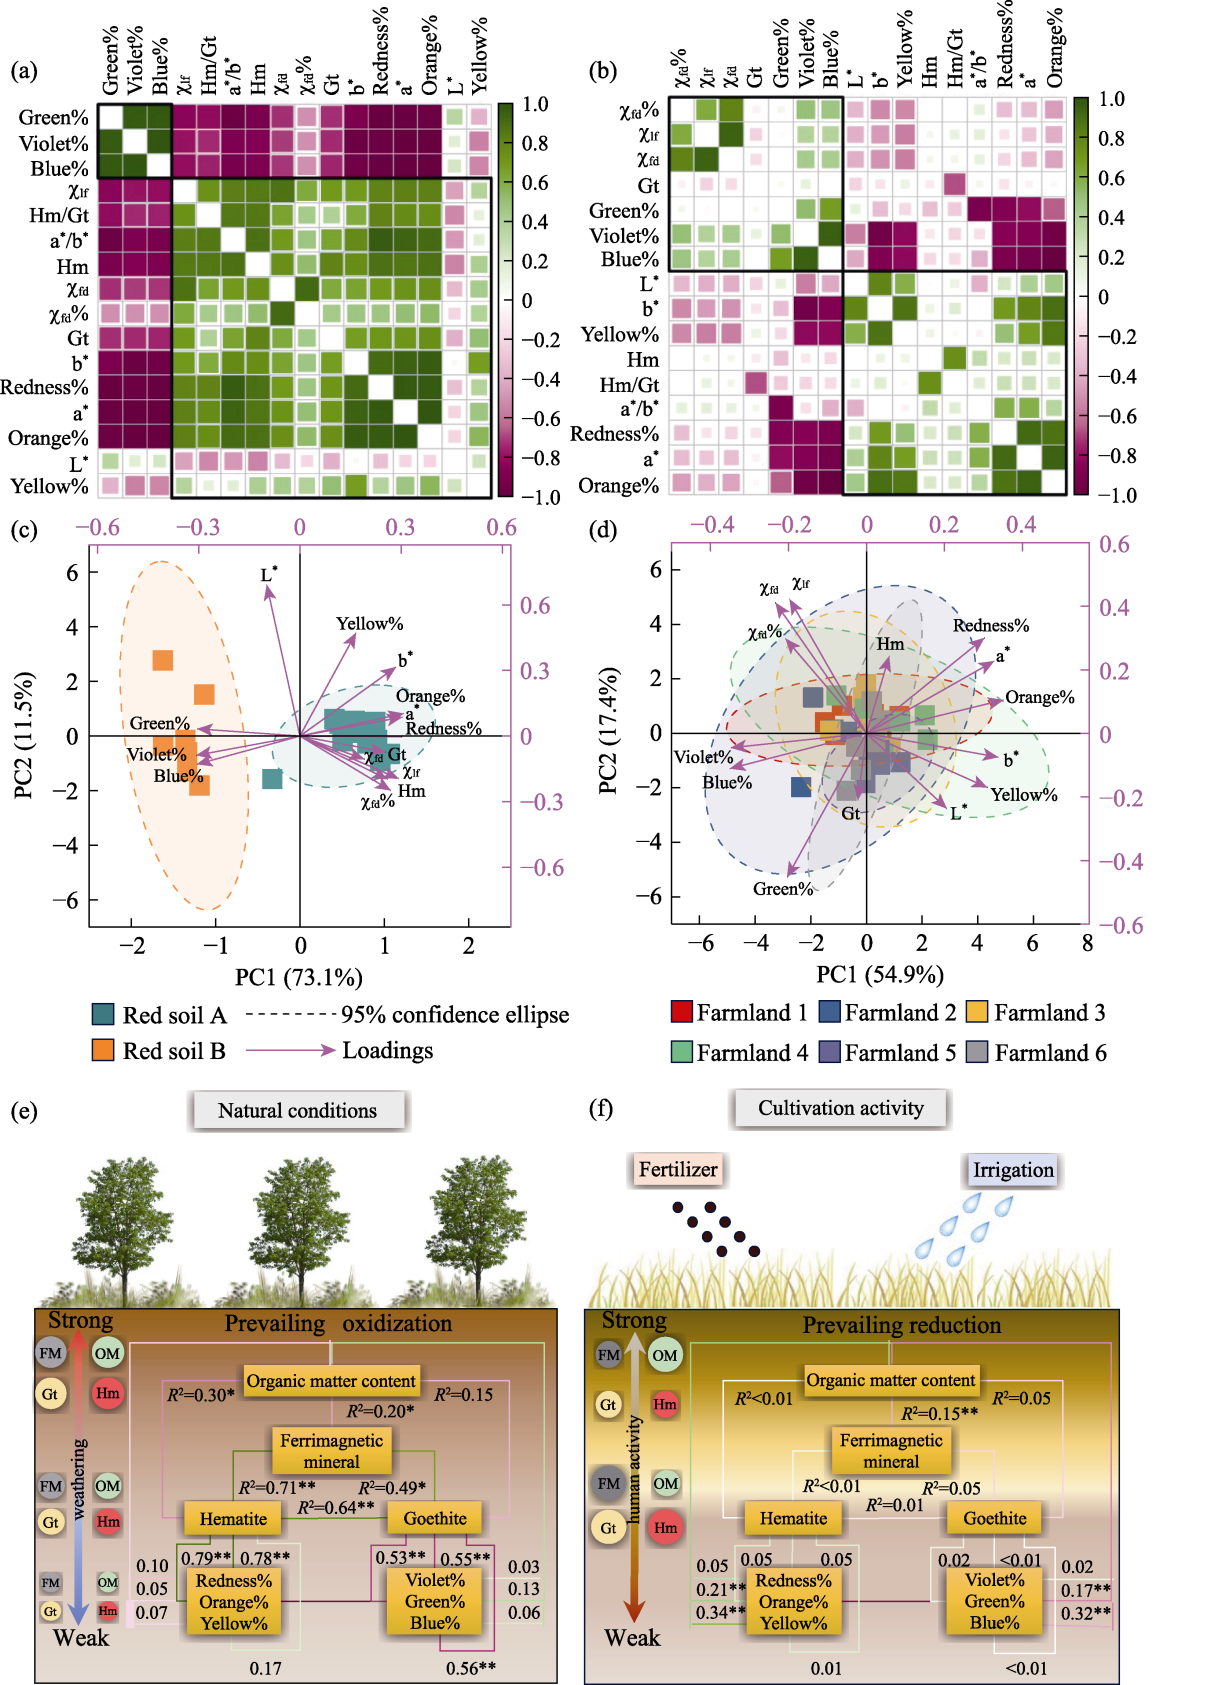
Figure 10 Correlation heatmap analysis (a, b) and principal component analysis (c, d) of various indicators within red and farmland soils; correlation between ferromagnetic mineral (FM), hematite (Hm), goethite (Gt), organic matter (OM), and soil color; and stratigraphic changes in magnetic minerals (e, f). The size of the circle corresponds to the average content within the layers, while the background color indicates the stratigraphic variations. Asterisks mark their significance: **, <0.01; or *, <0.05.
本文的其它图/表