×
模态框(Modal)标题
在这里添加一些文本
关闭
关闭
提交更改
取消
确定并提交
×
模态框(Modal)标题
×
期刊
文章
图表
检索
EN
中文
首页
关于期刊
期刊介绍
数据库收录
期刊荣誉
编委会
投稿指南
在线期刊
当期目录
优先出版
过刊浏览
推荐文章
专题
按栏目浏览
阅读排行
下载排行
引用排行
E-mail Alert
RSS
期刊订阅
广告合作
联系我们
EN
中文
图/表 详细信息
Characteristics of the iron mineralogy of farmland and red soils in eastern Guangdong and their pedogenetic implications
CHEN Zixuan, TANG Jinmeng, LIU Xin, LU Bin, YANG Junhuai, WANG Shuyuan, XIA Dunsheng
地理学报(英文版), 2025, 35(
9
): 2015-2036. DOI:
10.1007/s11442-025-2401-9
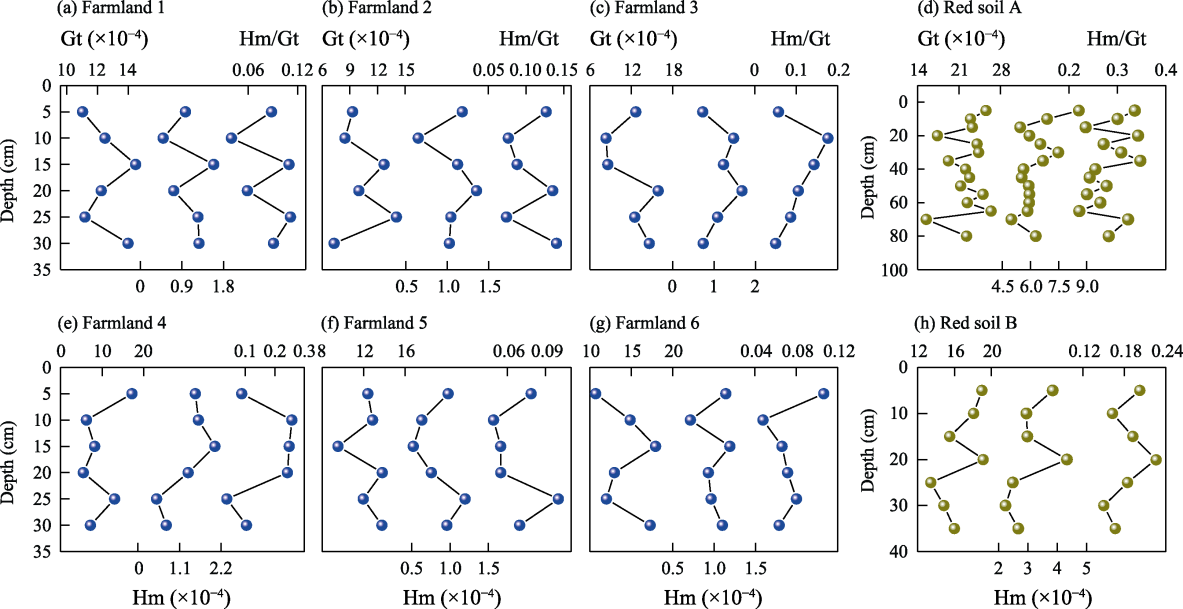
Figure 7
Changes in Hm, Gt and Hm/Gt based on depth in farmland and red soils
本文的其它图/表
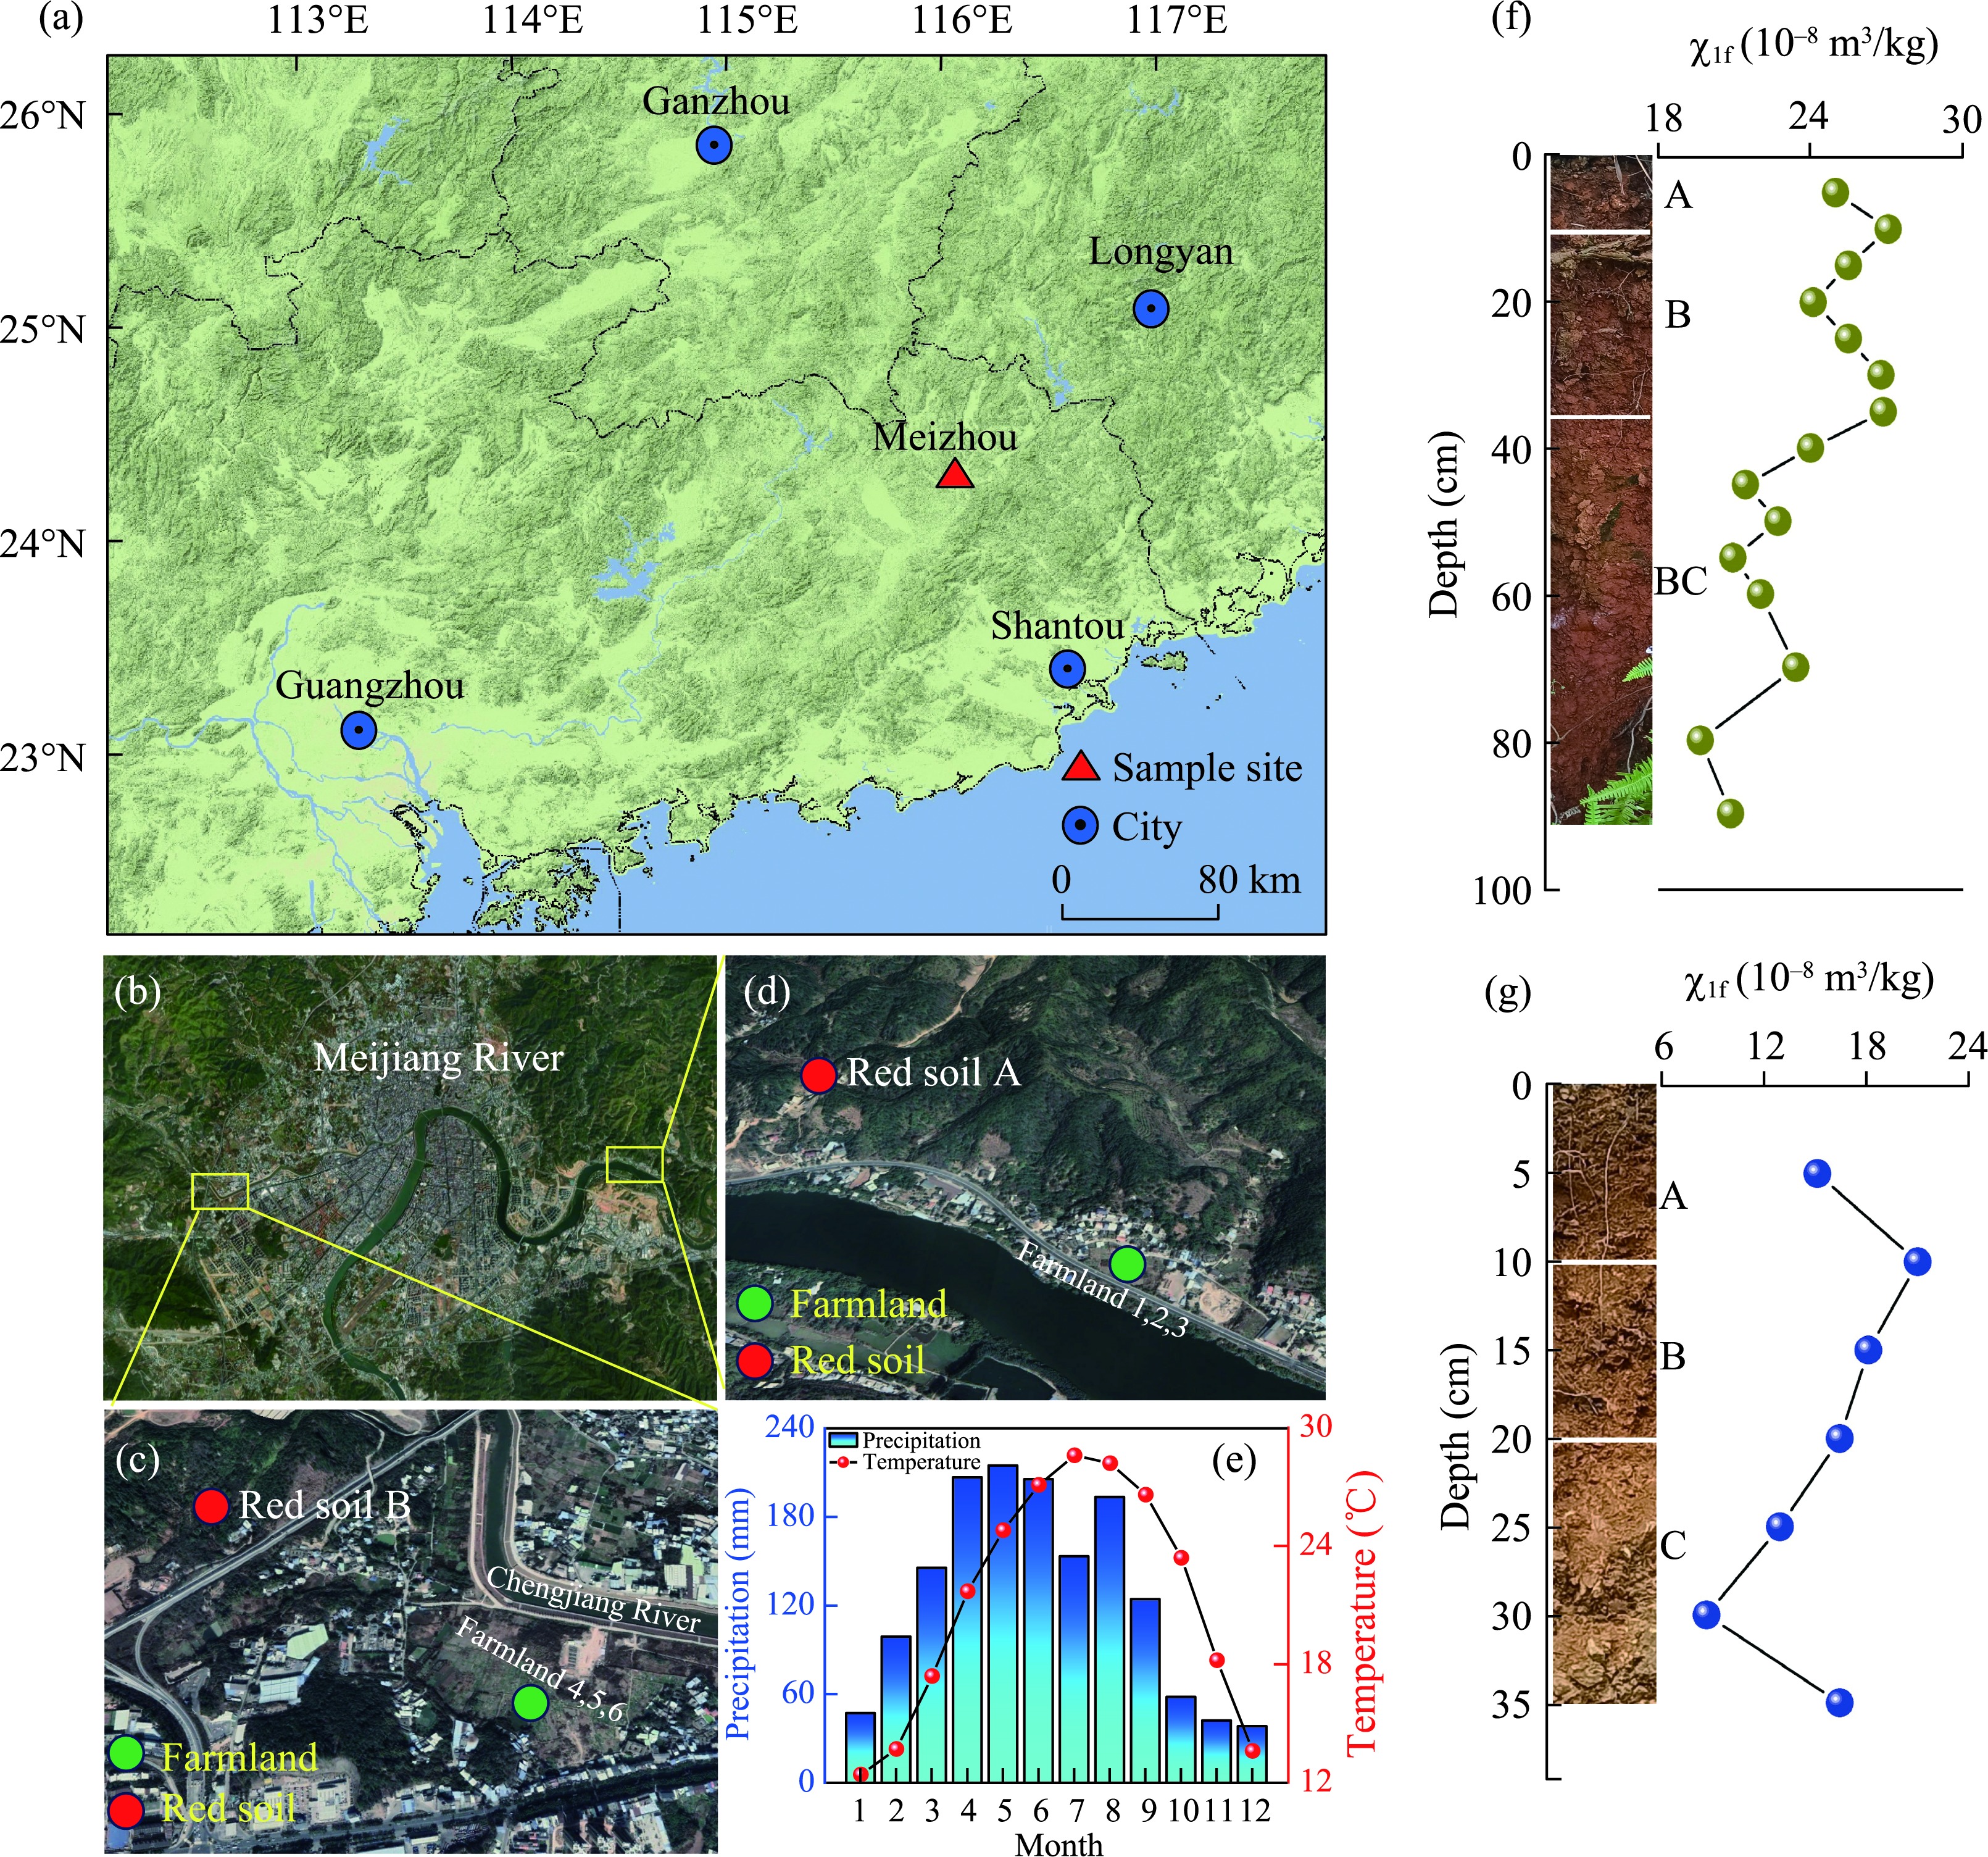
Figure 1
Study area (a), image of the area (b), sampling location (c, d), meteorological information (e), stratigraphy and magnetic susceptibility of red soil A (f), stratigraphy and magnetic susceptibility of red soil B (g) of Meizhou city
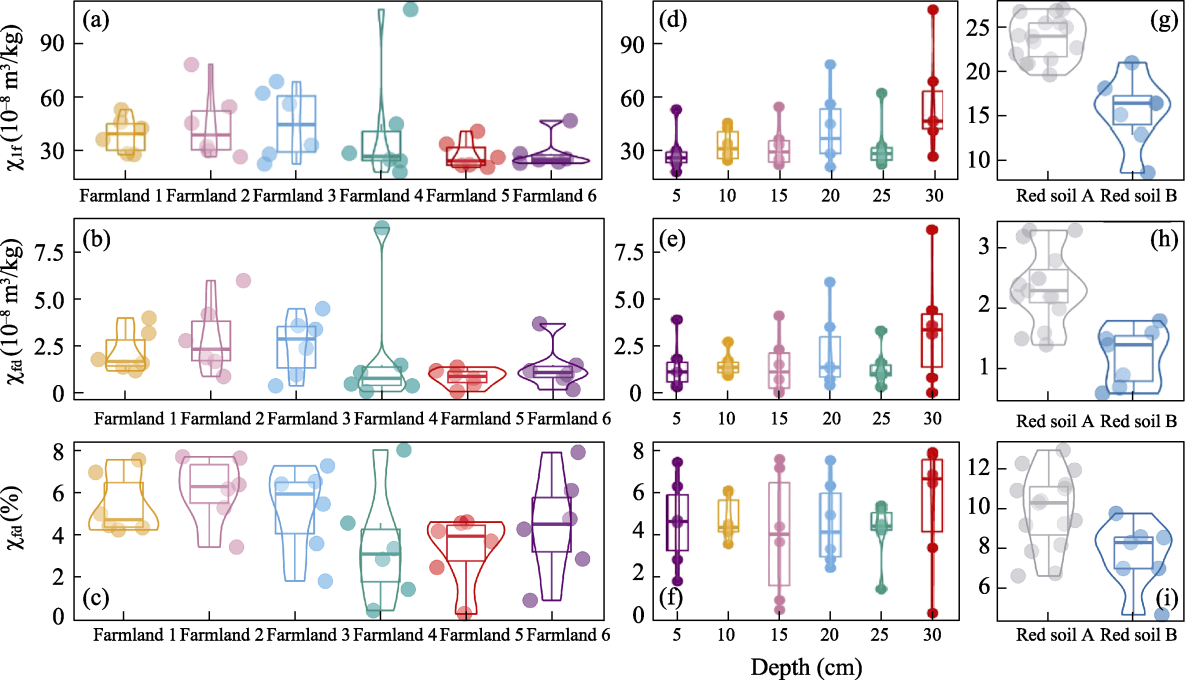
Figure 2
Violin box plots (a, b, c) and box plots based on depths (d, e, f) of χ
lf
, χ
fd
and χ
fd
% in various farmland; and violin box plots of χ
lf
, χ
fd
and χ
fd
% in the red soils (g, h, i)
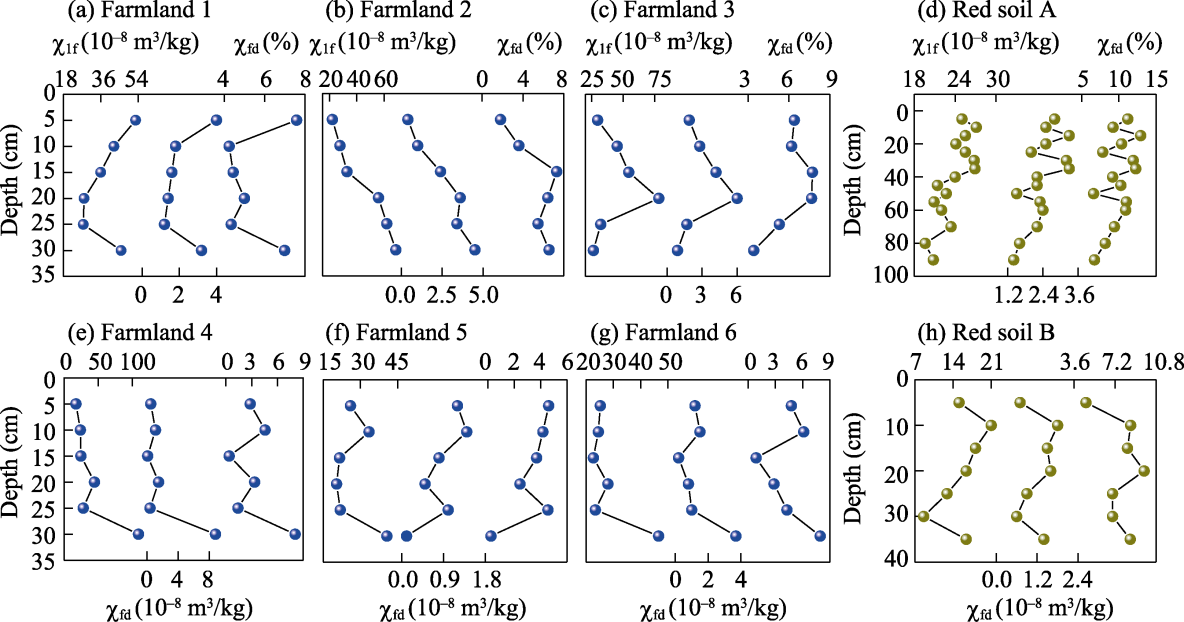
Figure 3
Changes in χ
lf
, χ
fd
and χ
fd
% based on the depth in farmland and red soils
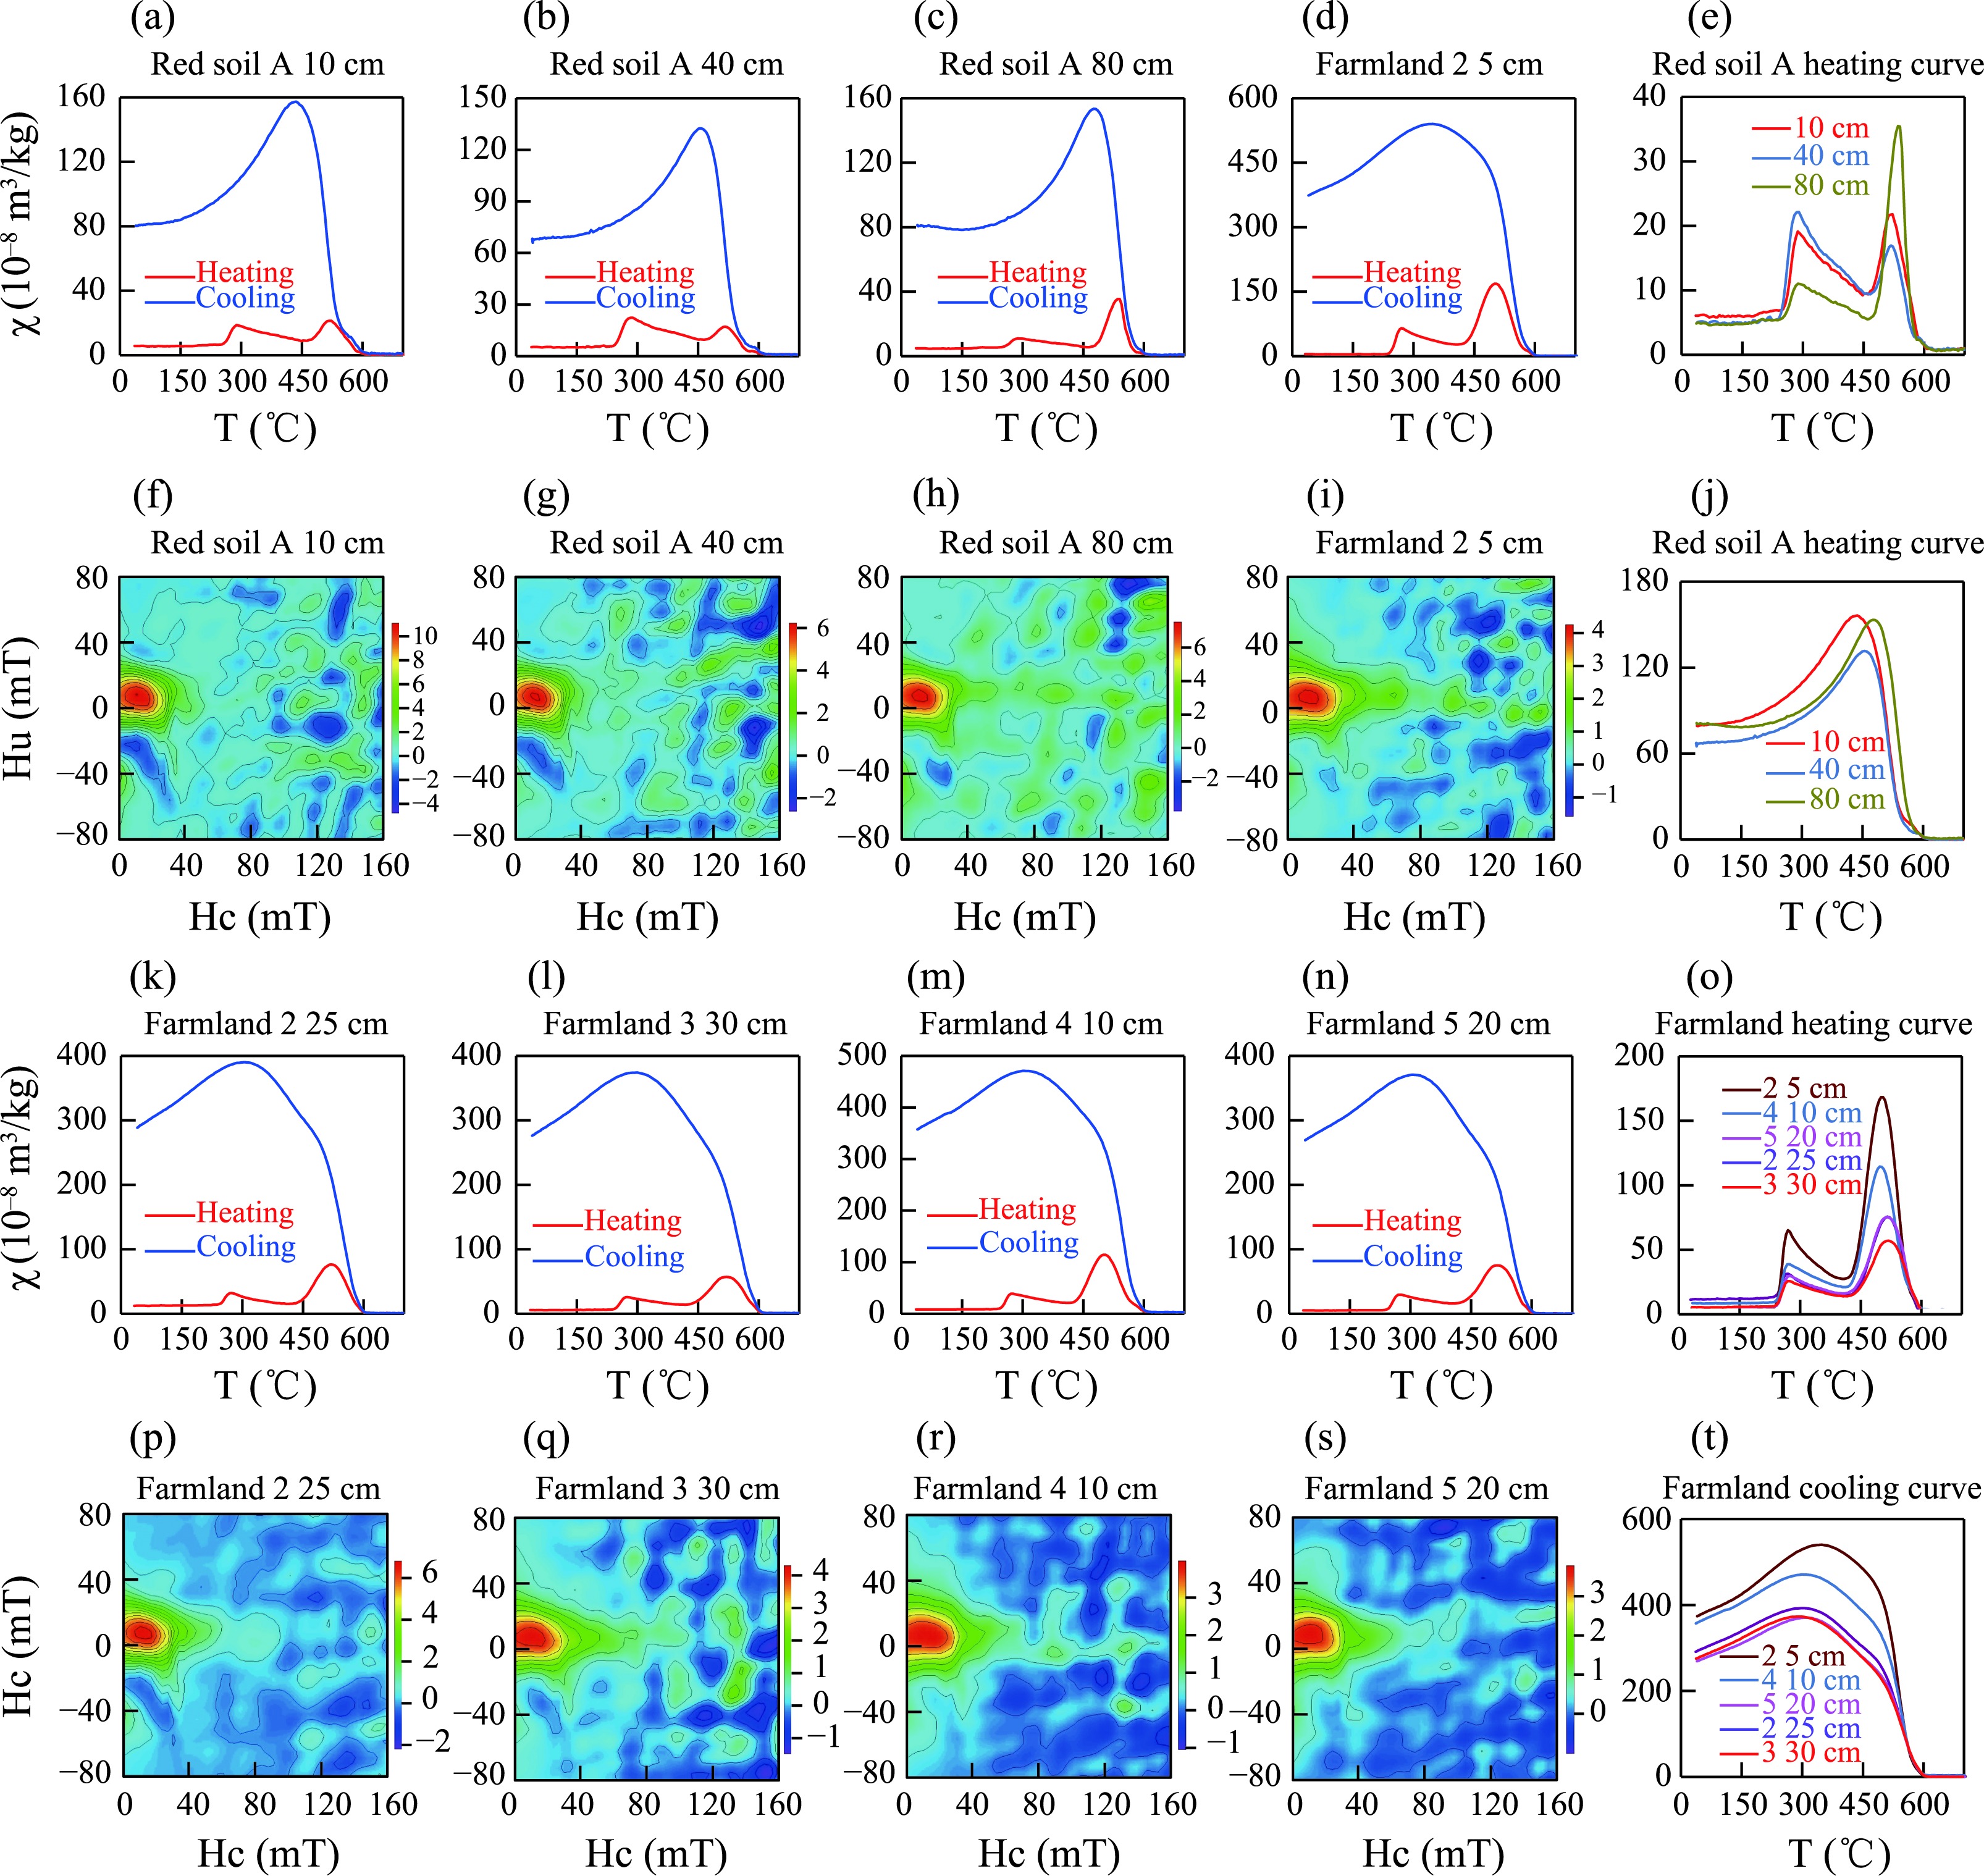
Figure 4
χ-T curves and FORC diagrams of typical samples from red and farmland soils
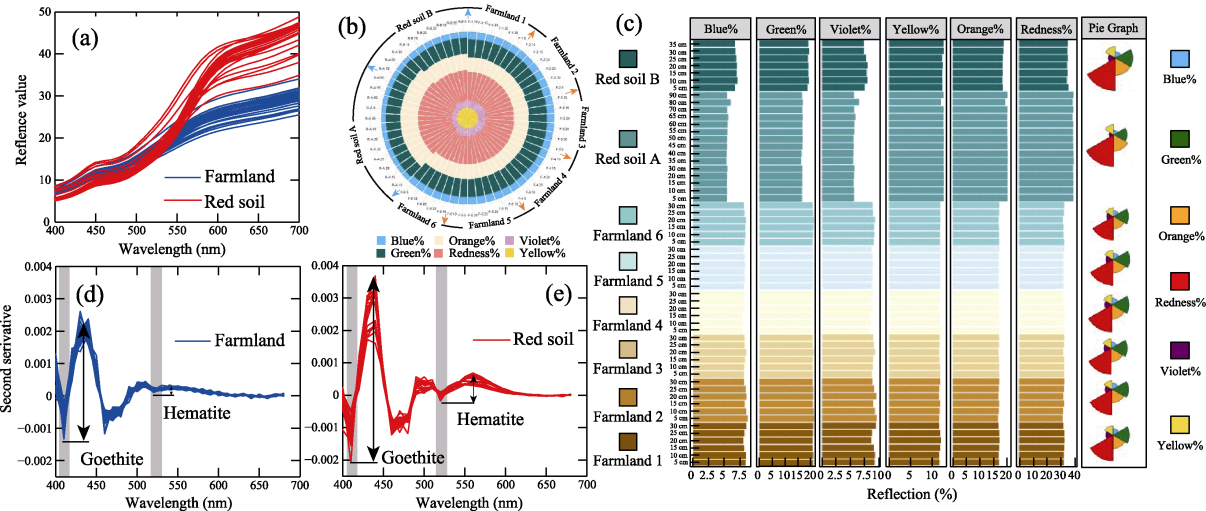
Figure 5
Diffuse reflectance spectroscopy (DRS) curves (a), stacked pie chart (b) of reflectivity for each color band, and bar chart of reflectivity for each color band with a pie chart of average values for each section (c), second-order derivative curve of DRS (d, e) of farmland and red soils
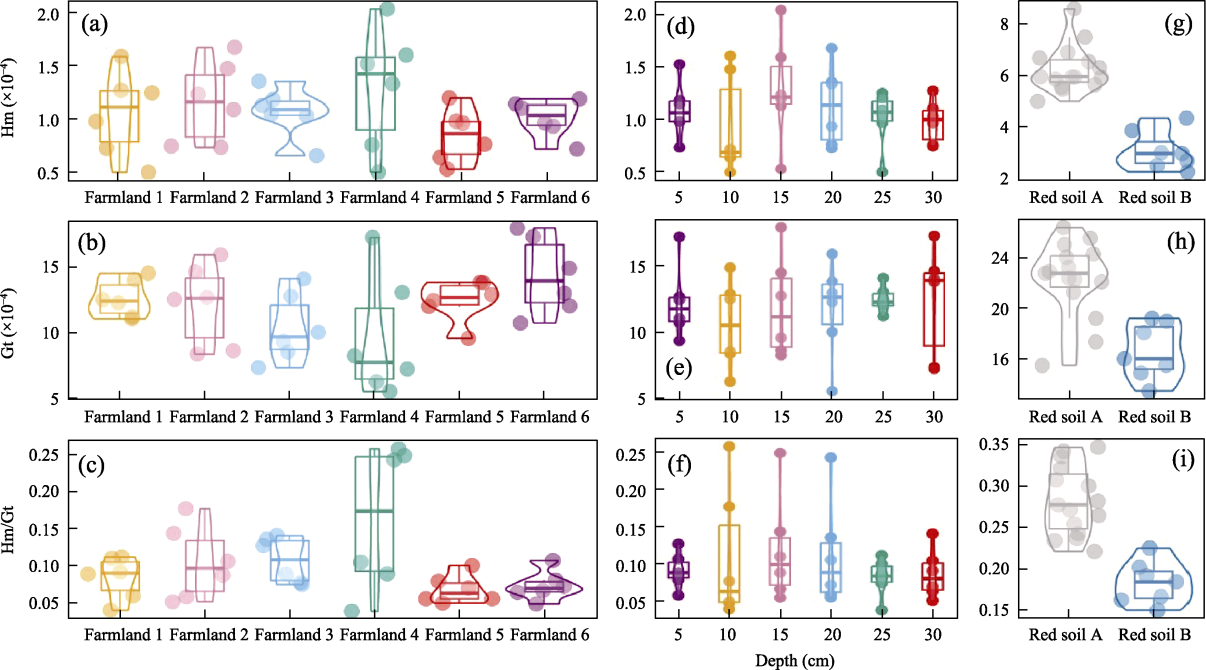
Figure 6
Violin boxplots (a, b, c) and box plots (d, e, f) based on depth of Hm, Gt, and Hm/Gt in various farmland; and violin boxplots of Hm, Gt, and Hm/Gt in red soils (g, h, i)
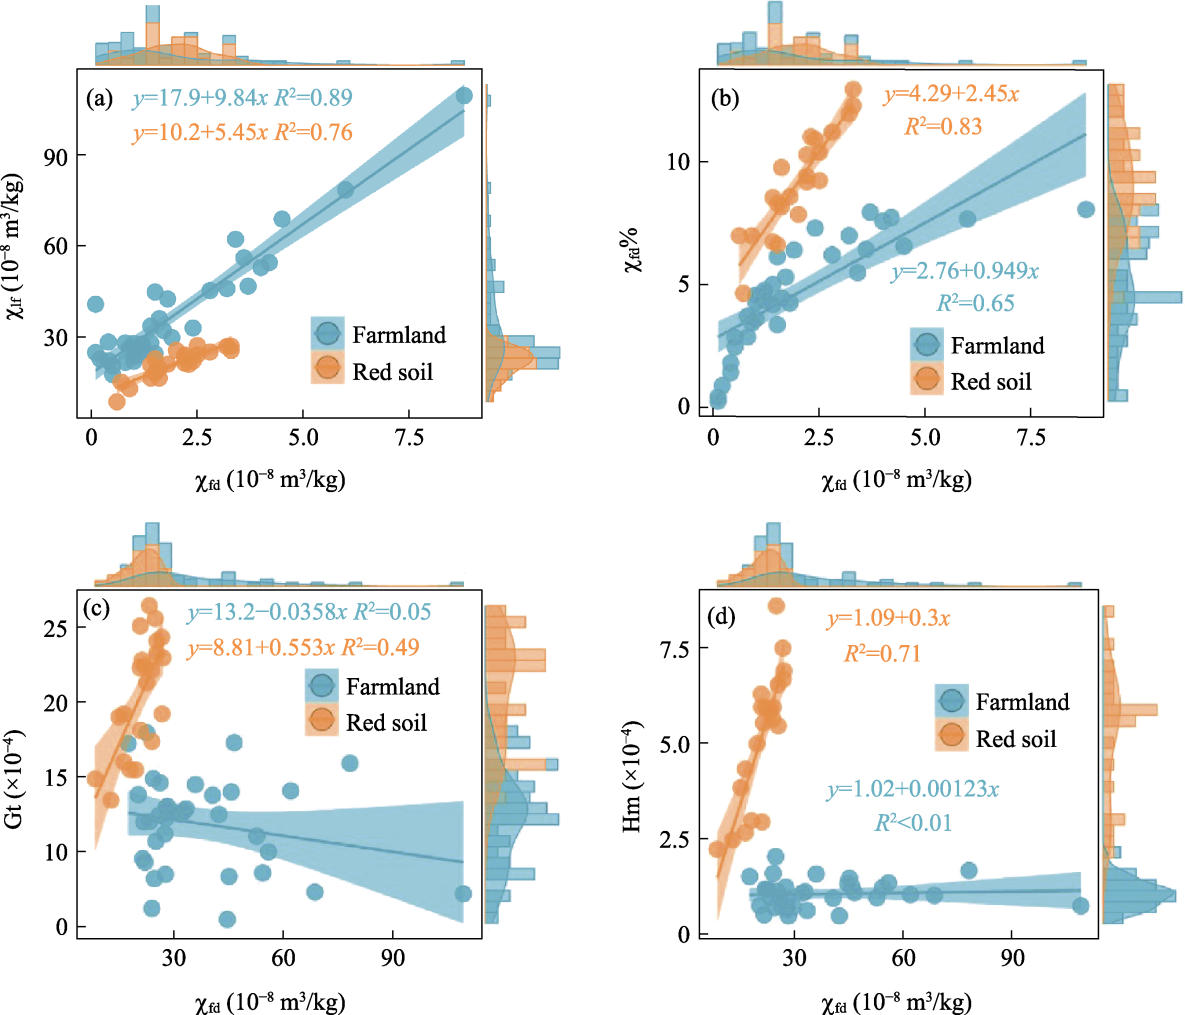
Figure 8
Scatter plot analysis of magnetic parameters (a. χ
fd
vs. χ
lf
; b. χ
fd
vs. χ
fd
%; c. χ
lf
vs. Gt; d. χ
lf
vs. Hm)
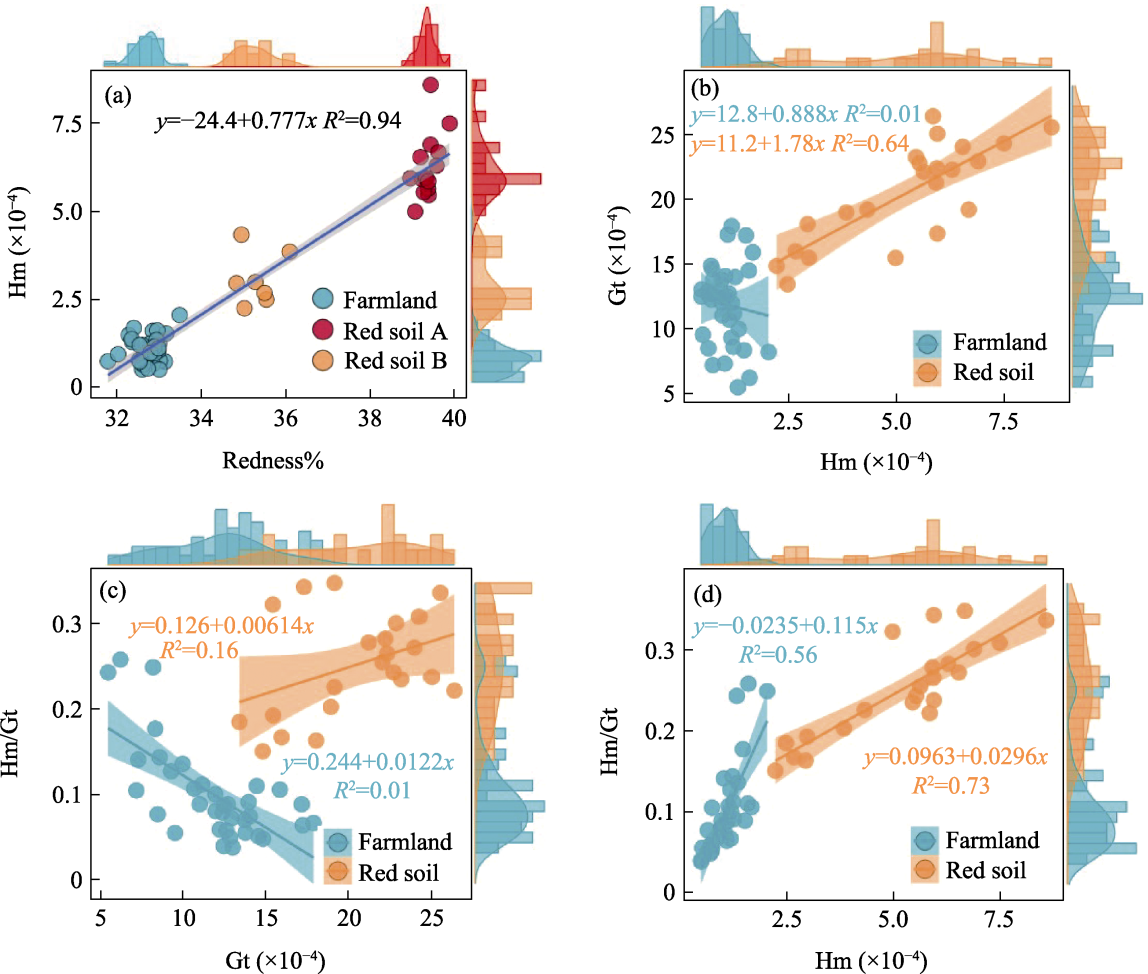
Figure 9
Scatter plot analysis of DRS parameters (a. Redness% vs. Hm; b. Hm vs. Gt; c. Gt vs. Hm/Gt; d. Hm vs. Hm/Gt)
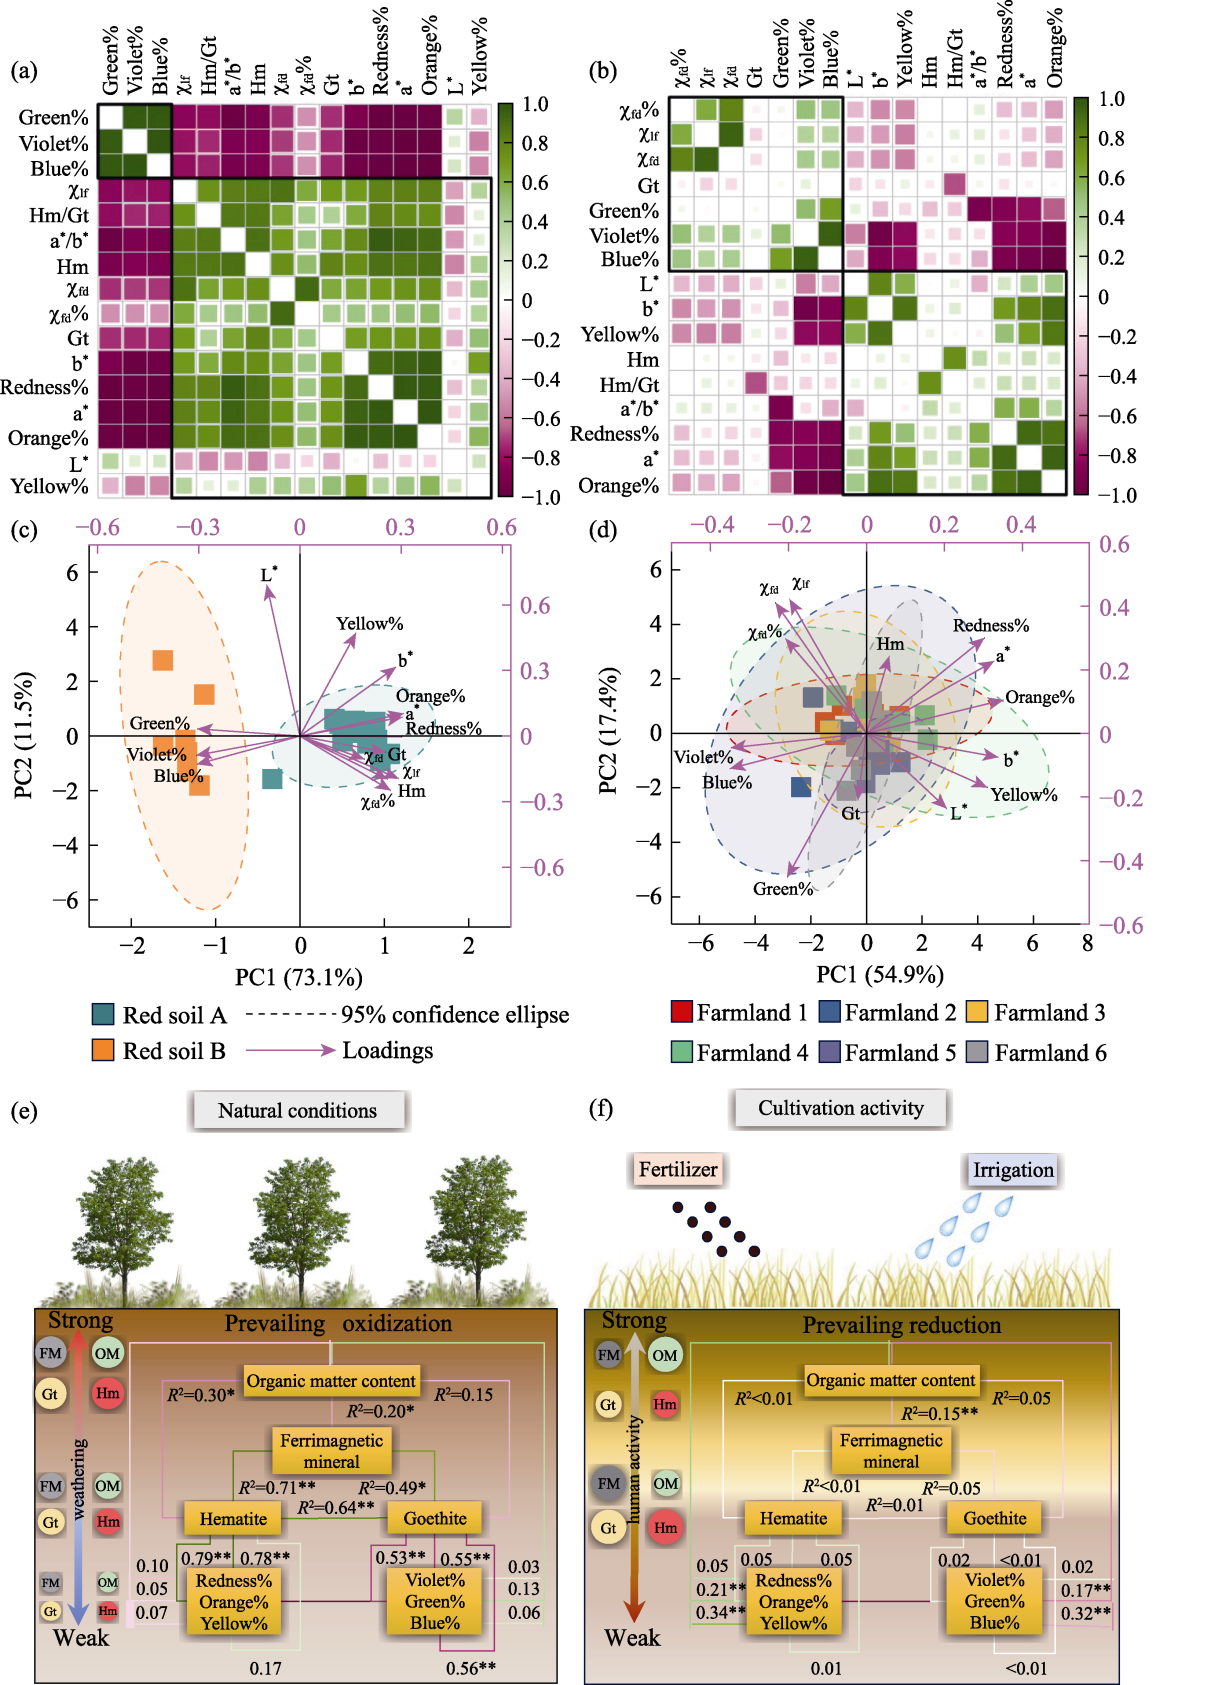
Figure 10
Correlation heatmap analysis (a, b) and principal component analysis (c, d) of various indicators within red and farmland soils; correlation between ferromagnetic mineral (FM), hematite (Hm), goethite (Gt), organic matter (OM), and soil color; and stratigraphic changes in magnetic minerals (e, f). The size of the circle corresponds to the average content within the layers, while the background color indicates the stratigraphic variations. Asterisks mark their significance: **, <0.01; or *, <0.05.