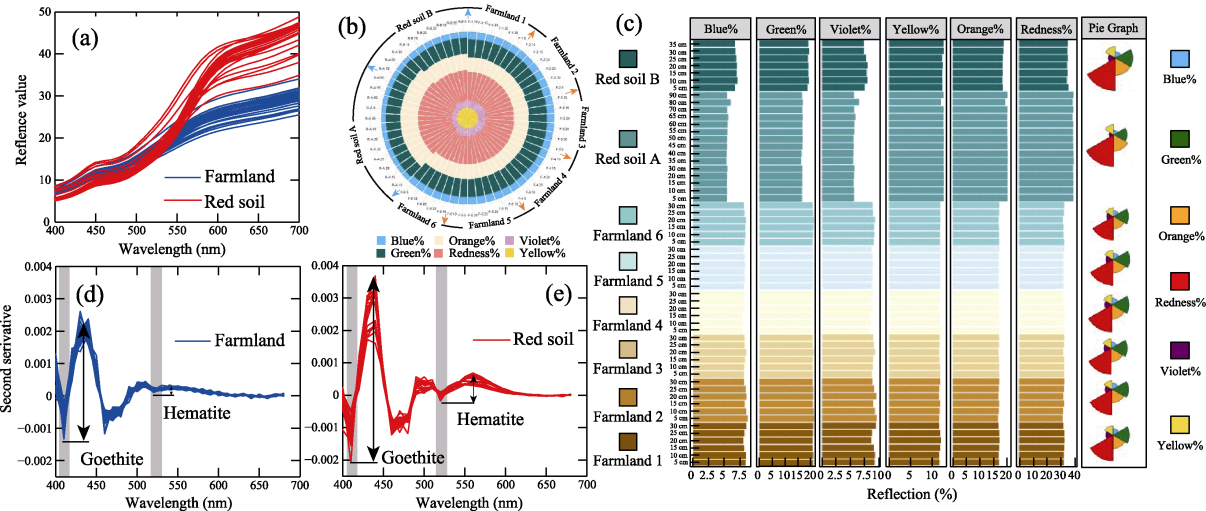
Figure 5 Diffuse reflectance spectroscopy (DRS) curves (a), stacked pie chart (b) of reflectivity for each color band, and bar chart of reflectivity for each color band with a pie chart of average values for each section (c), second-order derivative curve of DRS (d, e) of farmland and red soils
本文的其它图/表