×
模态框(Modal)标题
在这里添加一些文本
关闭
关闭
提交更改
取消
确定并提交
×
模态框(Modal)标题
×
期刊
文章
图表
检索
EN
中文
首页
关于期刊
期刊介绍
数据库收录
期刊荣誉
编委会
投稿指南
在线期刊
当期目录
优先出版
过刊浏览
推荐文章
专题
按栏目浏览
阅读排行
下载排行
引用排行
E-mail Alert
RSS
期刊订阅
广告合作
联系我们
EN
中文
图/表 详细信息
Investigating nonlinear factors influencing multi-scale urban land surface temperature using machine learning models
SHI Yue, FAN Qiang, SUN Shuang, SONG Xiaonan, ZHANG Bing
地理学报(英文版), 2025, 35(
9
): 1998-2014. DOI:
10.1007/s11442-025-2400-x
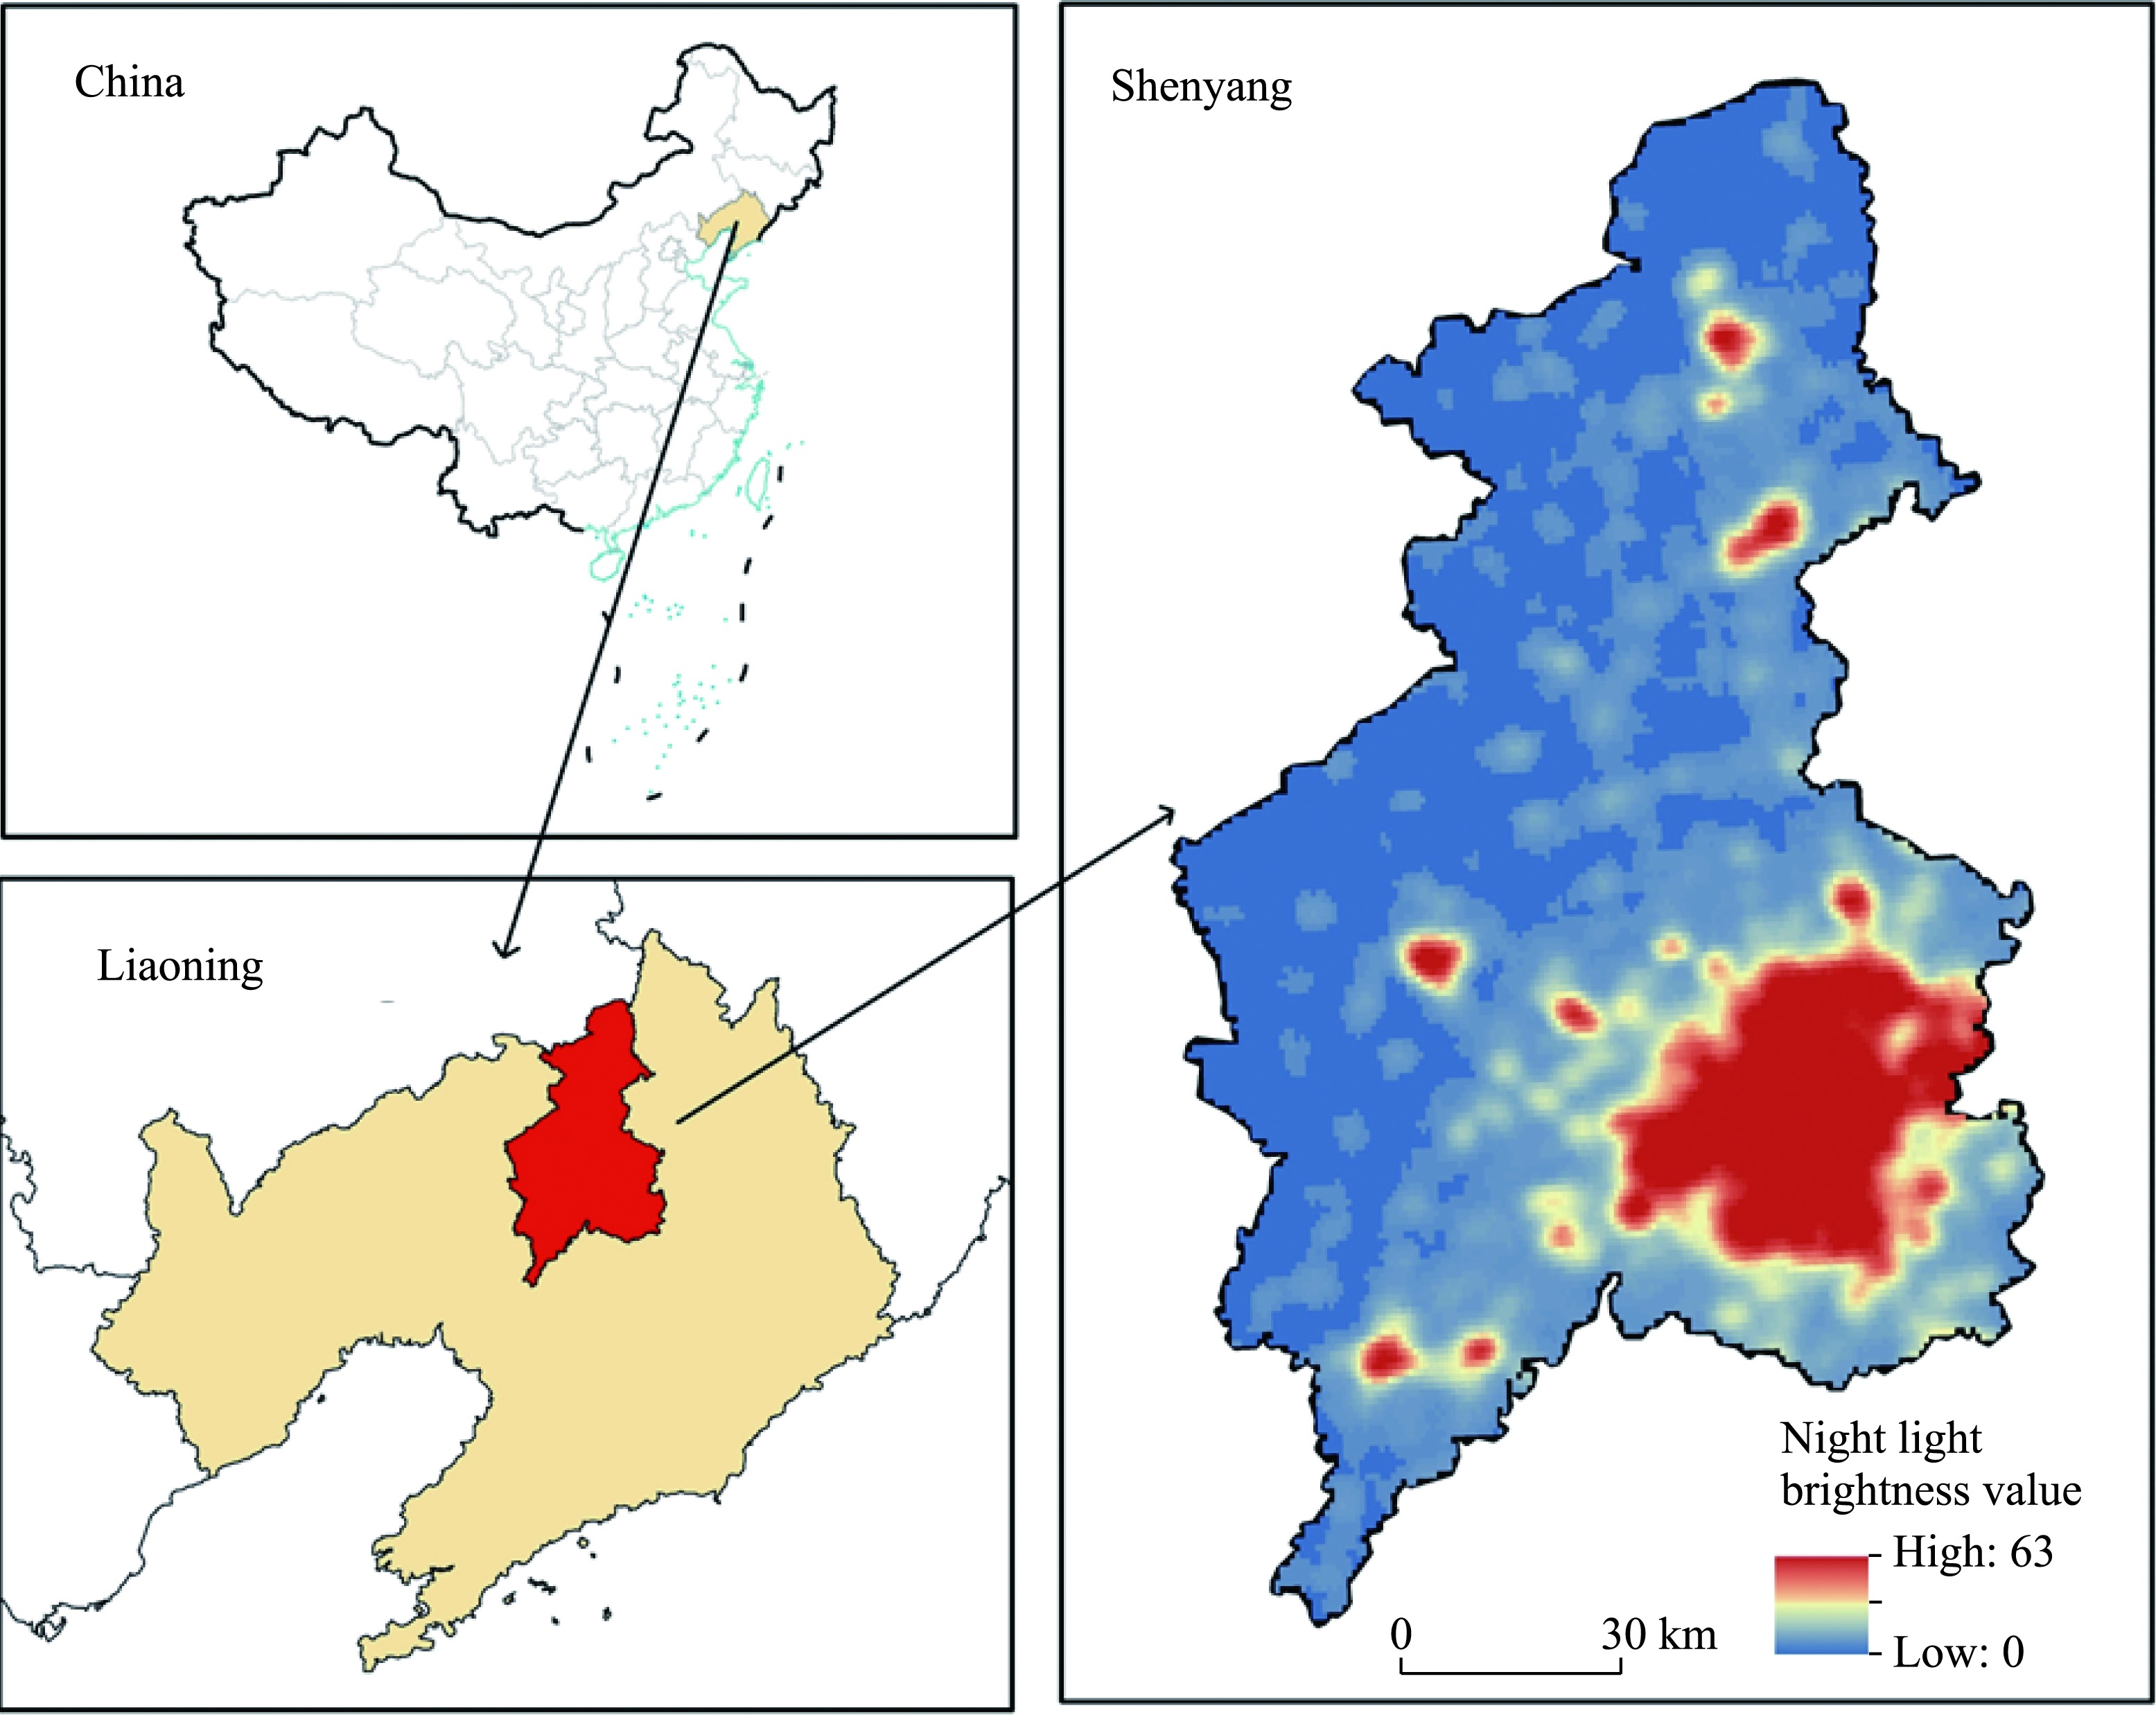
Figure 1
Location of Shenyang city, Liaoning province, Northeast China (Note: With the map approval number GS(2024)0650, the base map remains unmodified.)
本文的其它图/表
Table 1
Classification rules for different temperature zones
Table 2
Landscape index and its significance
Table 3
Factors influencing LST
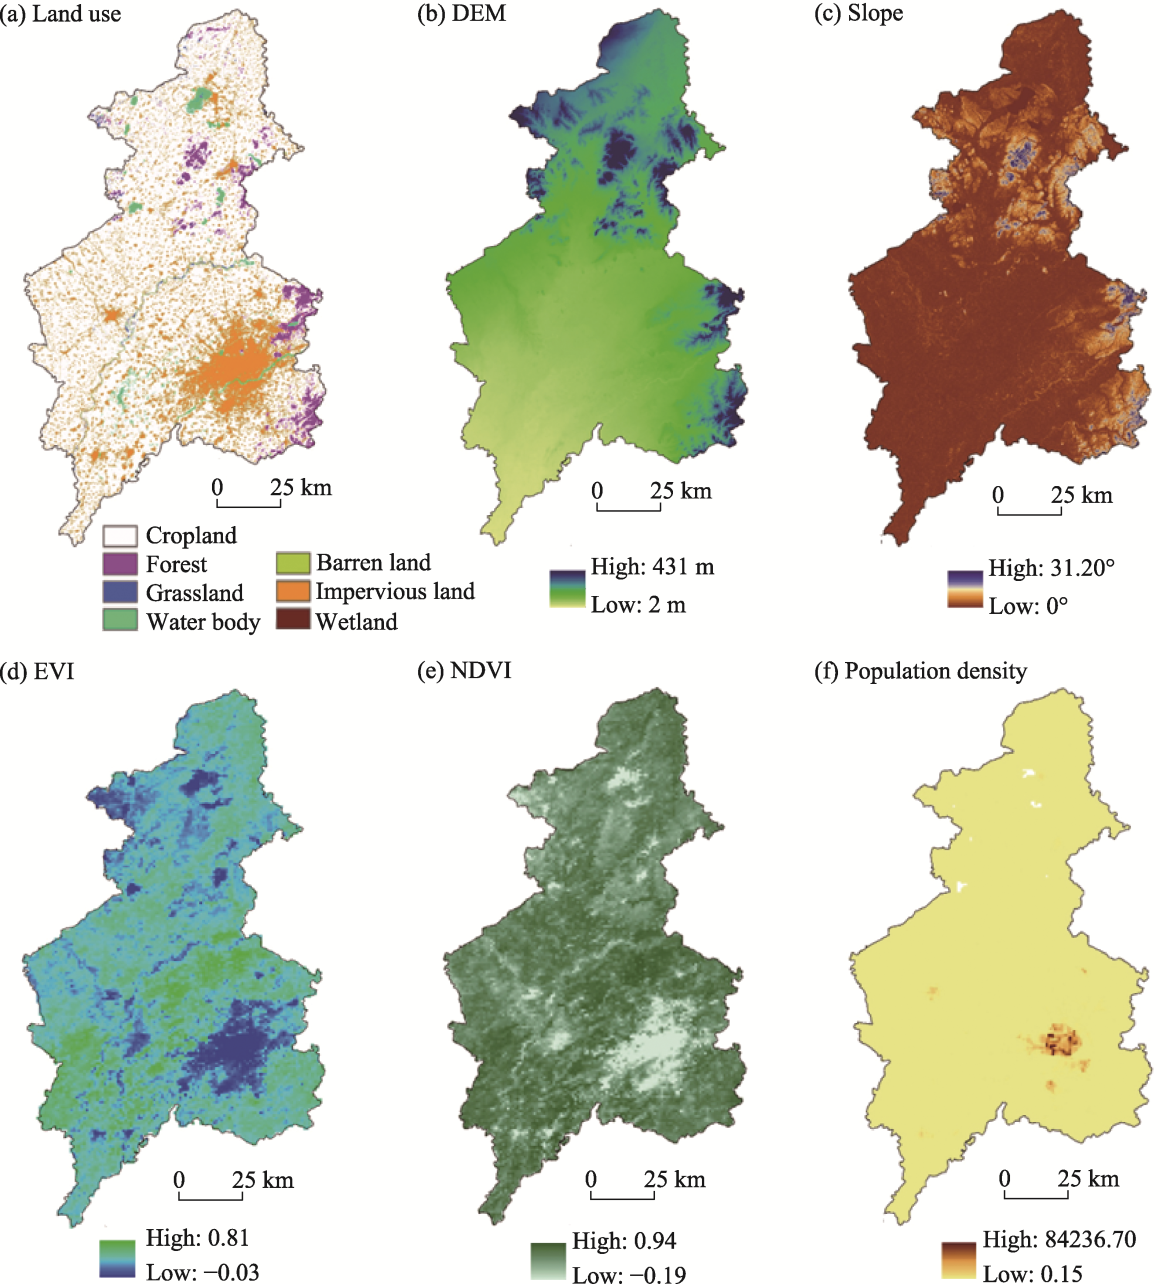
Figure 2
Spatial variation map of influencing factors in Shenyang for 2020 (Note: Owing to space limitations, only the spatial distribution of the influencing factors for 2020 is shown.)
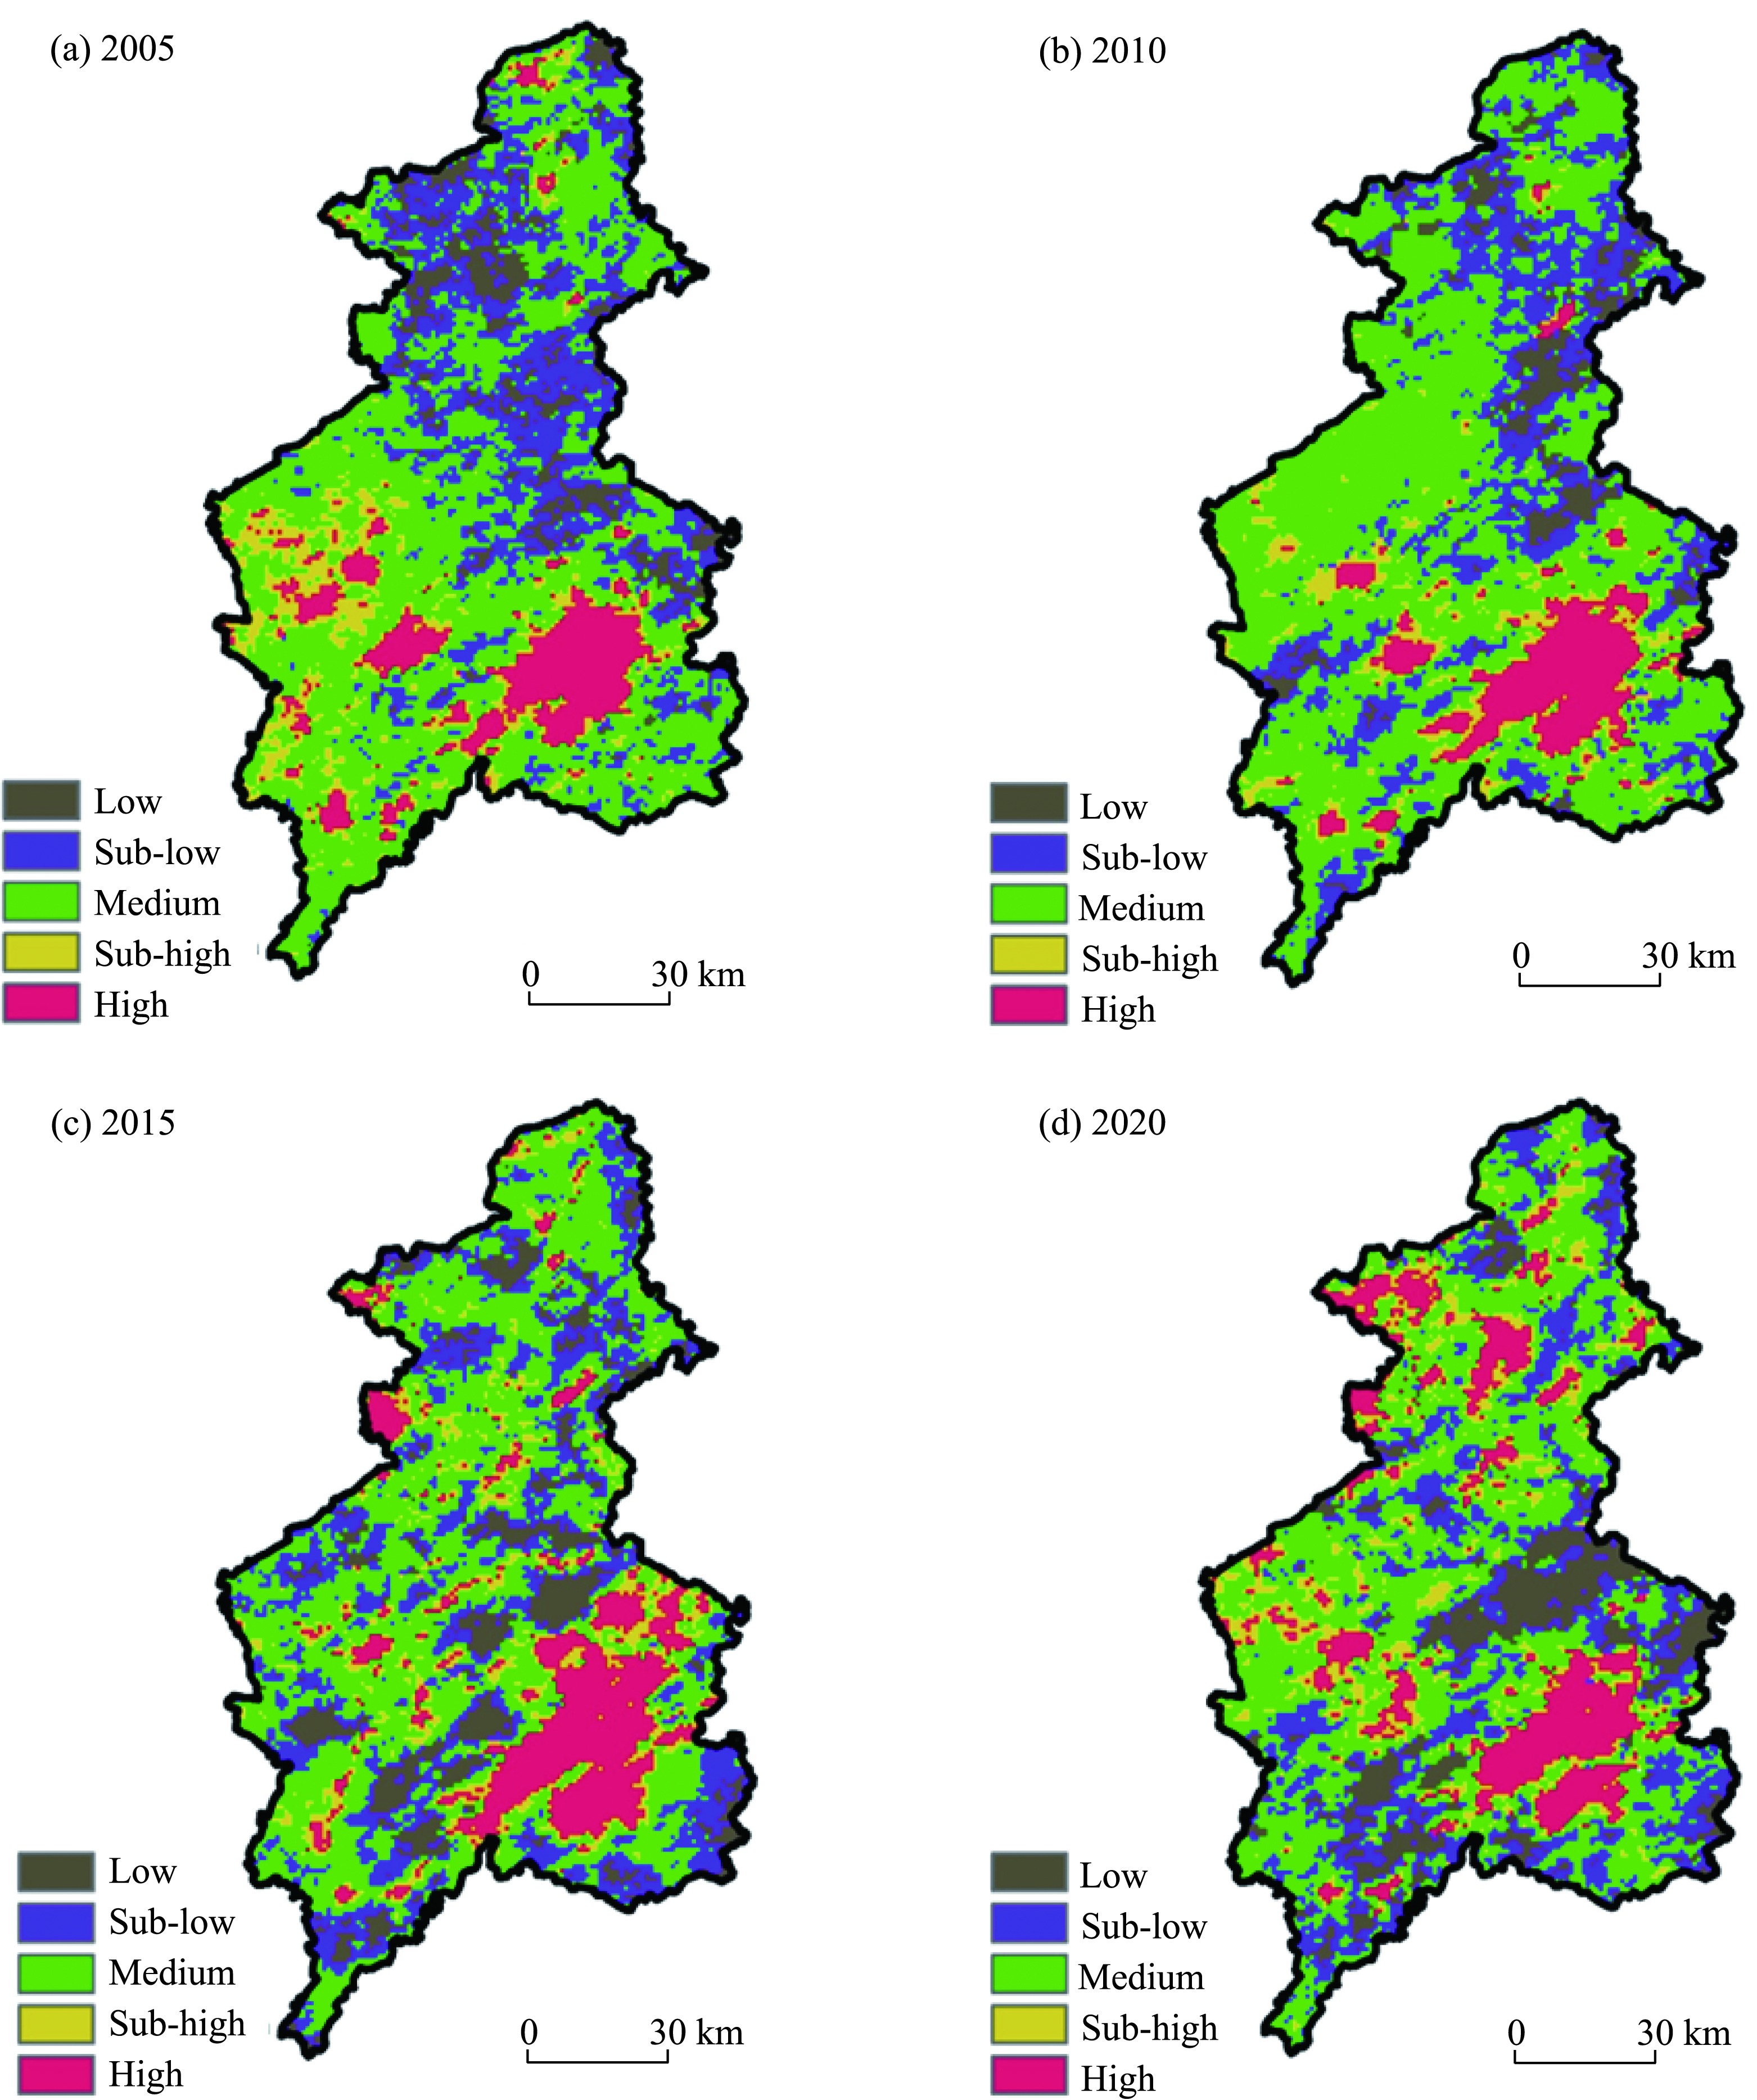
Figure 3
Mean standard deviation classification map of LST in Shenyang for 2005, 2010, 2015 and 2020
Table 4
Area and proportion of temperature classifications
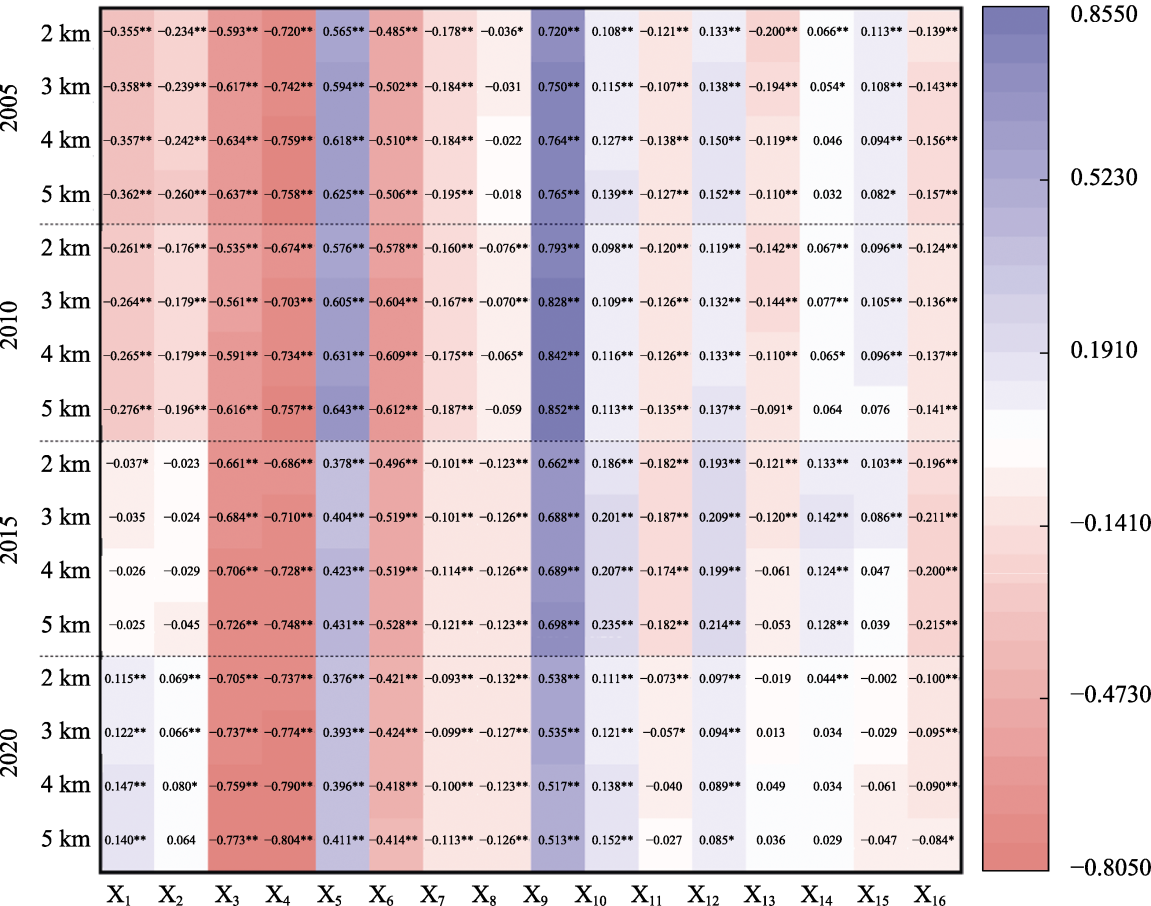
Figure 4
Pearson’s analysis results at different scales for 2005, 2010, 2015 and 2020 (*p < 0.05, ** p < 0.01)
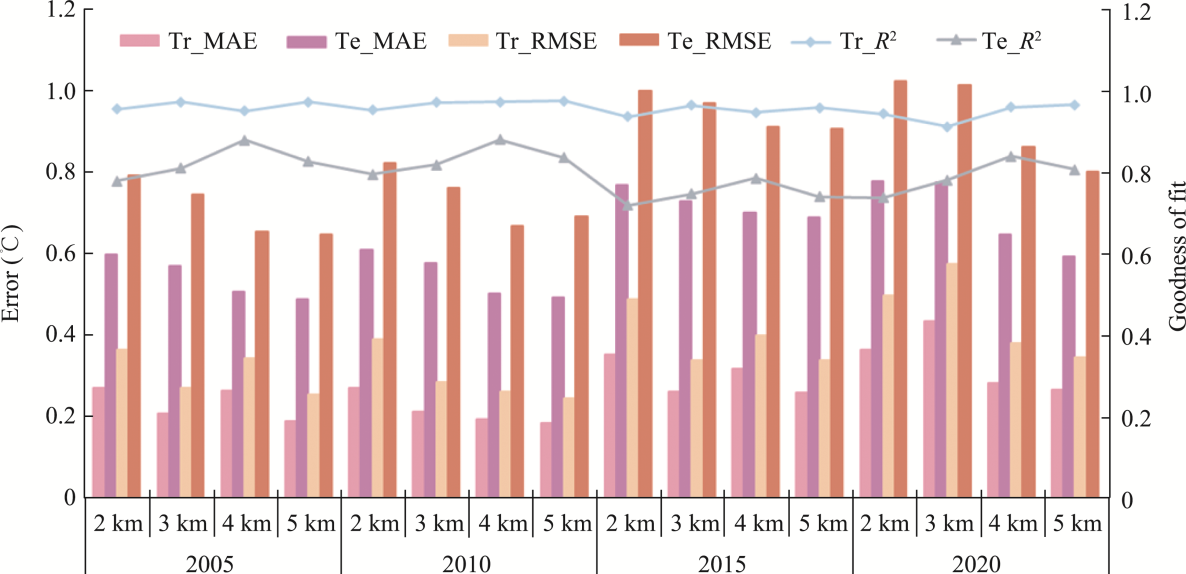
Figure 5
Training and test set results
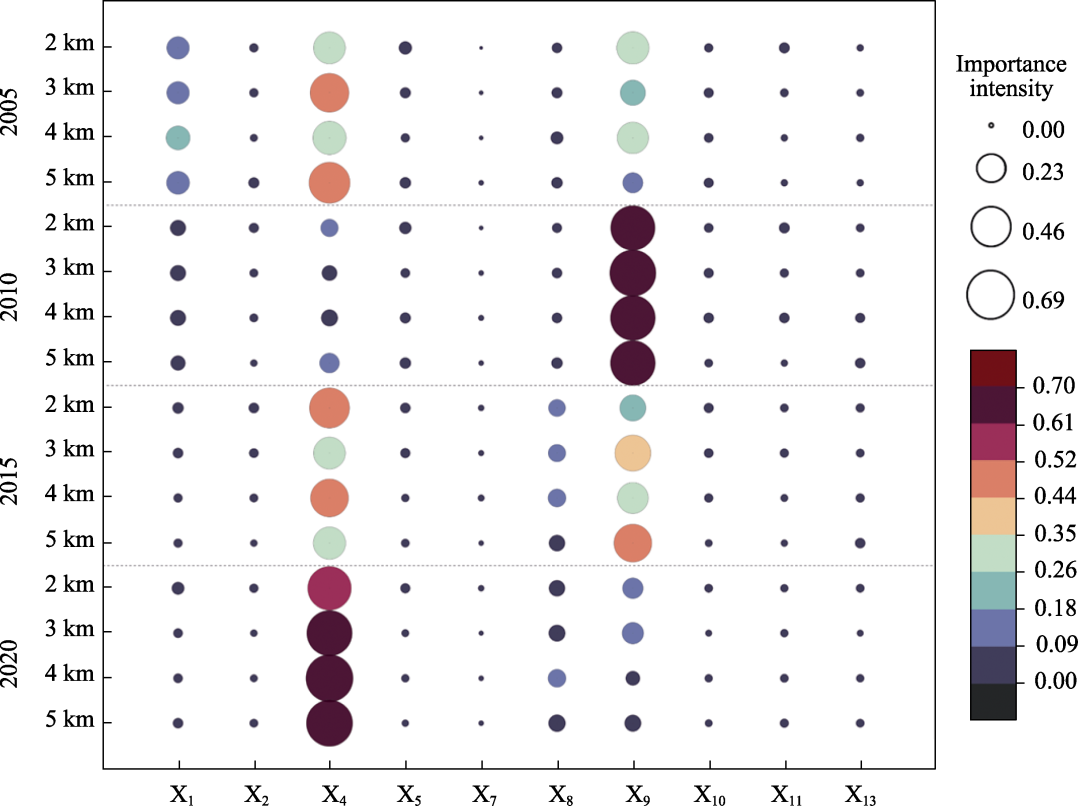
Figure 6
Significance ranking of factors (The size of the symbols represents the strength of the influence, while the colour gradient visually illustrates the impact of each factor on LST.)