Recent advances on reconstruction of climate and extreme events in China for the past 2000 years
|
Recent advances on reconstruction of climate and extreme events in China for the past 2000 years |
| Quansheng GE, Jingyun *ZHENG, Zhixin HAO, Yang LIU, Mingqi LI |
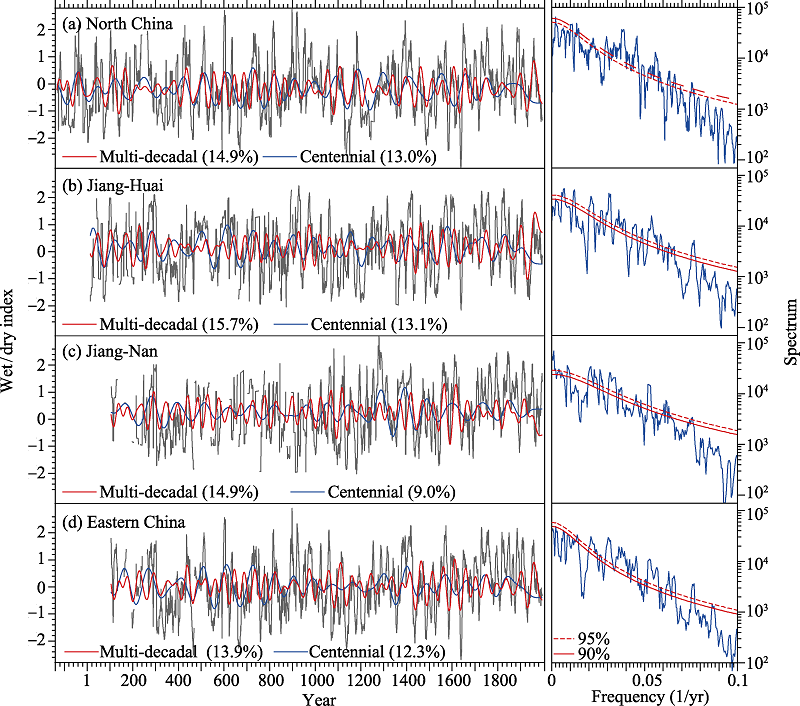
| Figure 3 Regional dry/wet index series for the North China Plain (a), Jiang-Huai area (b), Jiang-Nan area (c), and central eastern China (d) for the past 2000 years derived from yearly drought/flood grade dataset after detrending the effect of data missing on the homogeneity ( |
|
|