Recent advances on reconstruction of climate and extreme events in China for the past 2000 years
|
Recent advances on reconstruction of climate and extreme events in China for the past 2000 years |
| Quansheng GE, Jingyun *ZHENG, Zhixin HAO, Yang LIU, Mingqi LI |
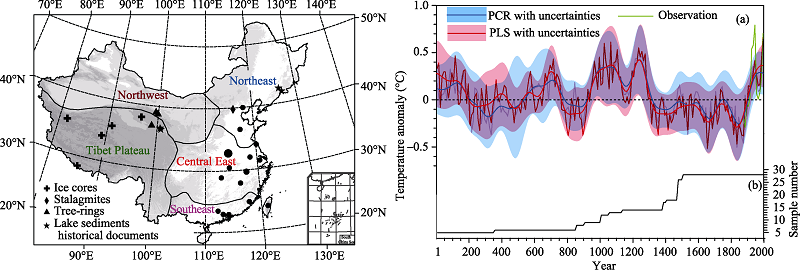
| Figure 1 Locations and types of 28 temperature proxies (left panel), and temperature reconstructions for China ( |
|
|